Demos
See how it works
Narrated walkthroughs recorded from the product. Follow a path if you have a task in mind, or browse by phase. Nothing to install and no signup to watch.
Pick what you are trying to do
Each path is a short run of walkthroughs covering one task from start to finish.
Get your first strategy in
From an empty account to a structured plan with owners, dates and budget, and a view to track it from.
Start this pathThe business case, end to end
Build the case on the model that fits, read the analysis the platform returns, and record the decision.
- 1Build a Business Case in Six Fields~2 min
- 2Read the Analysis, Make the Call~1 min
- 3Getting a Business Case Approved~1 min
Ways to start
Start a strategy your way
Upload a document, start from a template, describe the intent in your own words, or start from a case study that already worked.
4 demos · about 5 min
Many strategies
Run a portfolio, not a plan
Every strategy competing for the same budget and the same teams, scored and ranked against each other, with a proposal for how to split what you have.
3 demos · about 4 min
Forecasting
See where outcomes are heading
Where each outcome is predicted to end up, how confident the platform is in that, and whether the milestones under it will land on time.
4 demos · about 7 min
For finance
Pick the model that fits
Seven business case models, one for each kind of question. Each wizard is entered live from the first field to the investment decision, with the mechanics of the model stated as it goes.
7 demos · about 13 min
For executives
Govern the plan, then prove the value
Who has the responsibility to decide, how each decision and vote is recorded, and the score that says how much of the plan has been agreed. Then what was promised against what actually arrived, and the readouts that show it.
7 demos · about 8 min
For risk owners
Manage risk end to end
From an unscored register to priced risks, predicted trends and mitigations that get measured.
4 demos · about 5 min
For delivery leads
Run the weekly cycle
What needs you today, what moved, a short check in, and the schedule everyone asks about.
3 demos · about 4 min
For consulting firms
Run a firm of client organizations
Manage many client organizations from one login, and control who can see and change what.
2 demos · about 2 min
Planning
Planning is where a strategy is captured and structured. There are four ways to get one in, depending on whether you already have a document, a template in mind, or only an intent. The canvas then holds objectives, outcomes, initiatives and milestones together, and the portfolio view shows every strategy against the same budget and the same people.
9 demos
about 12 min
 ~2 min
Strategy lead
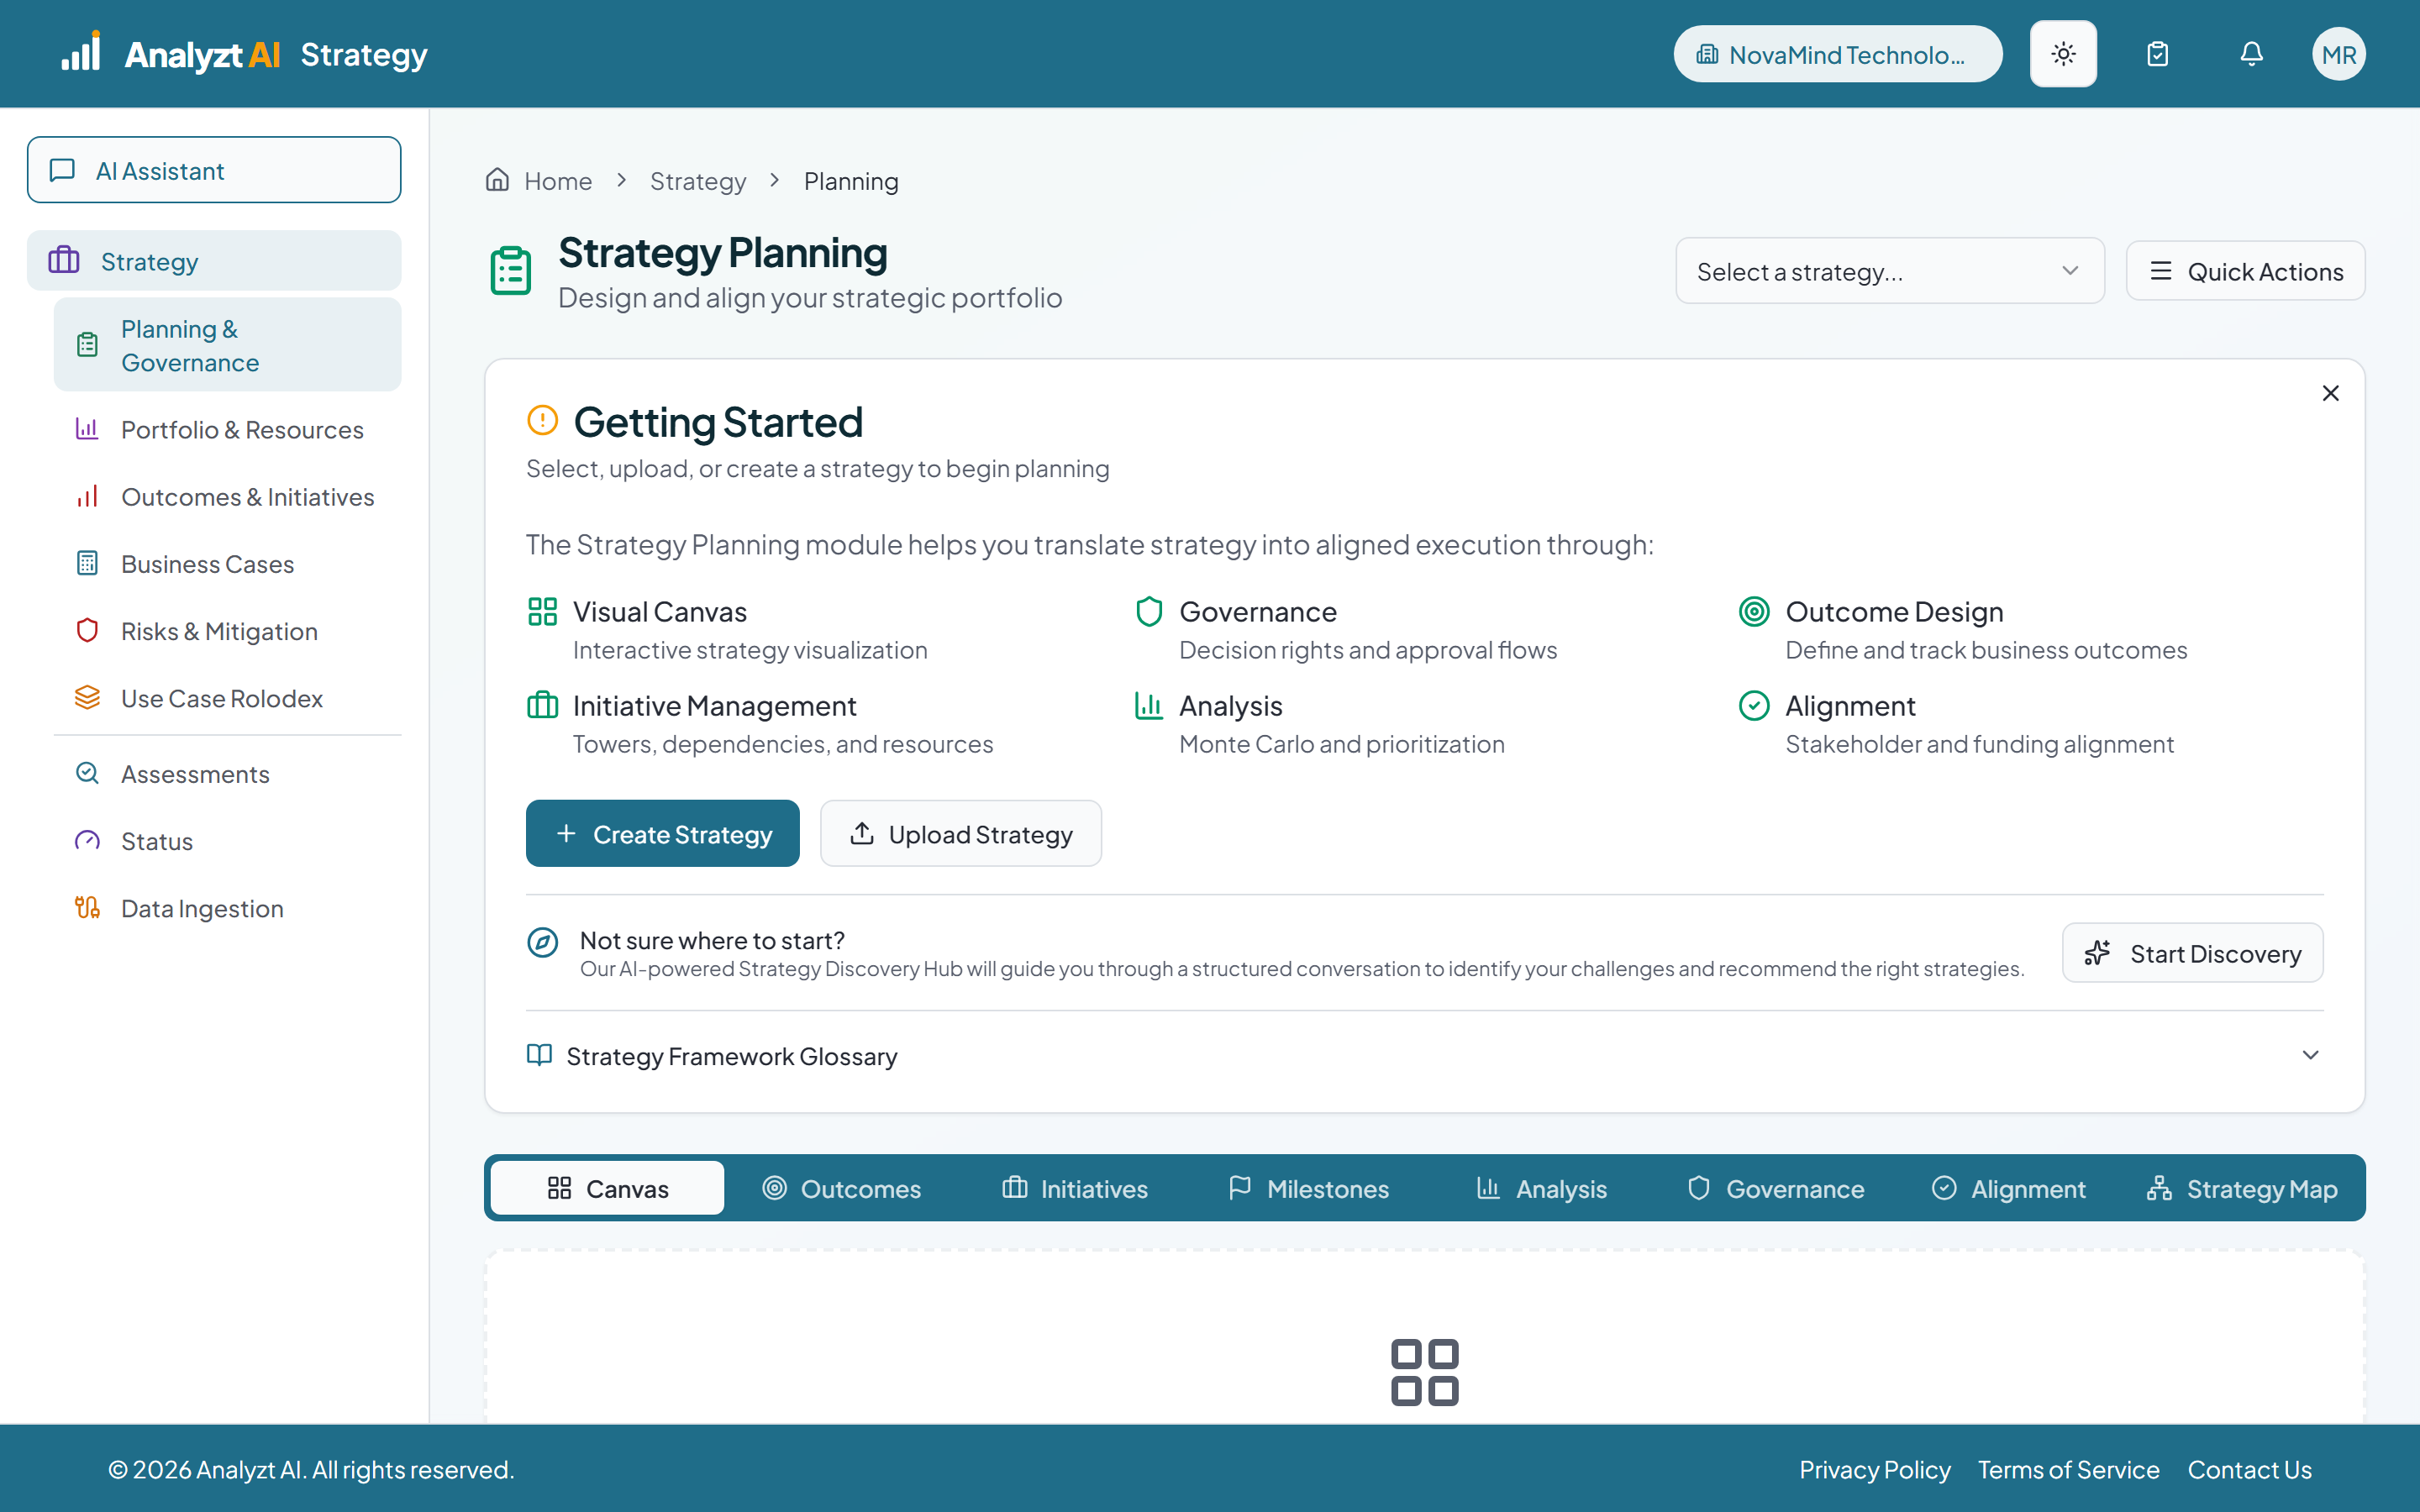
Guided Discovery
You do not need to know where to start. Answer questions in plain language and the platform builds the first draft of your strategy from your answers.
 ~2 min
Strategy lead
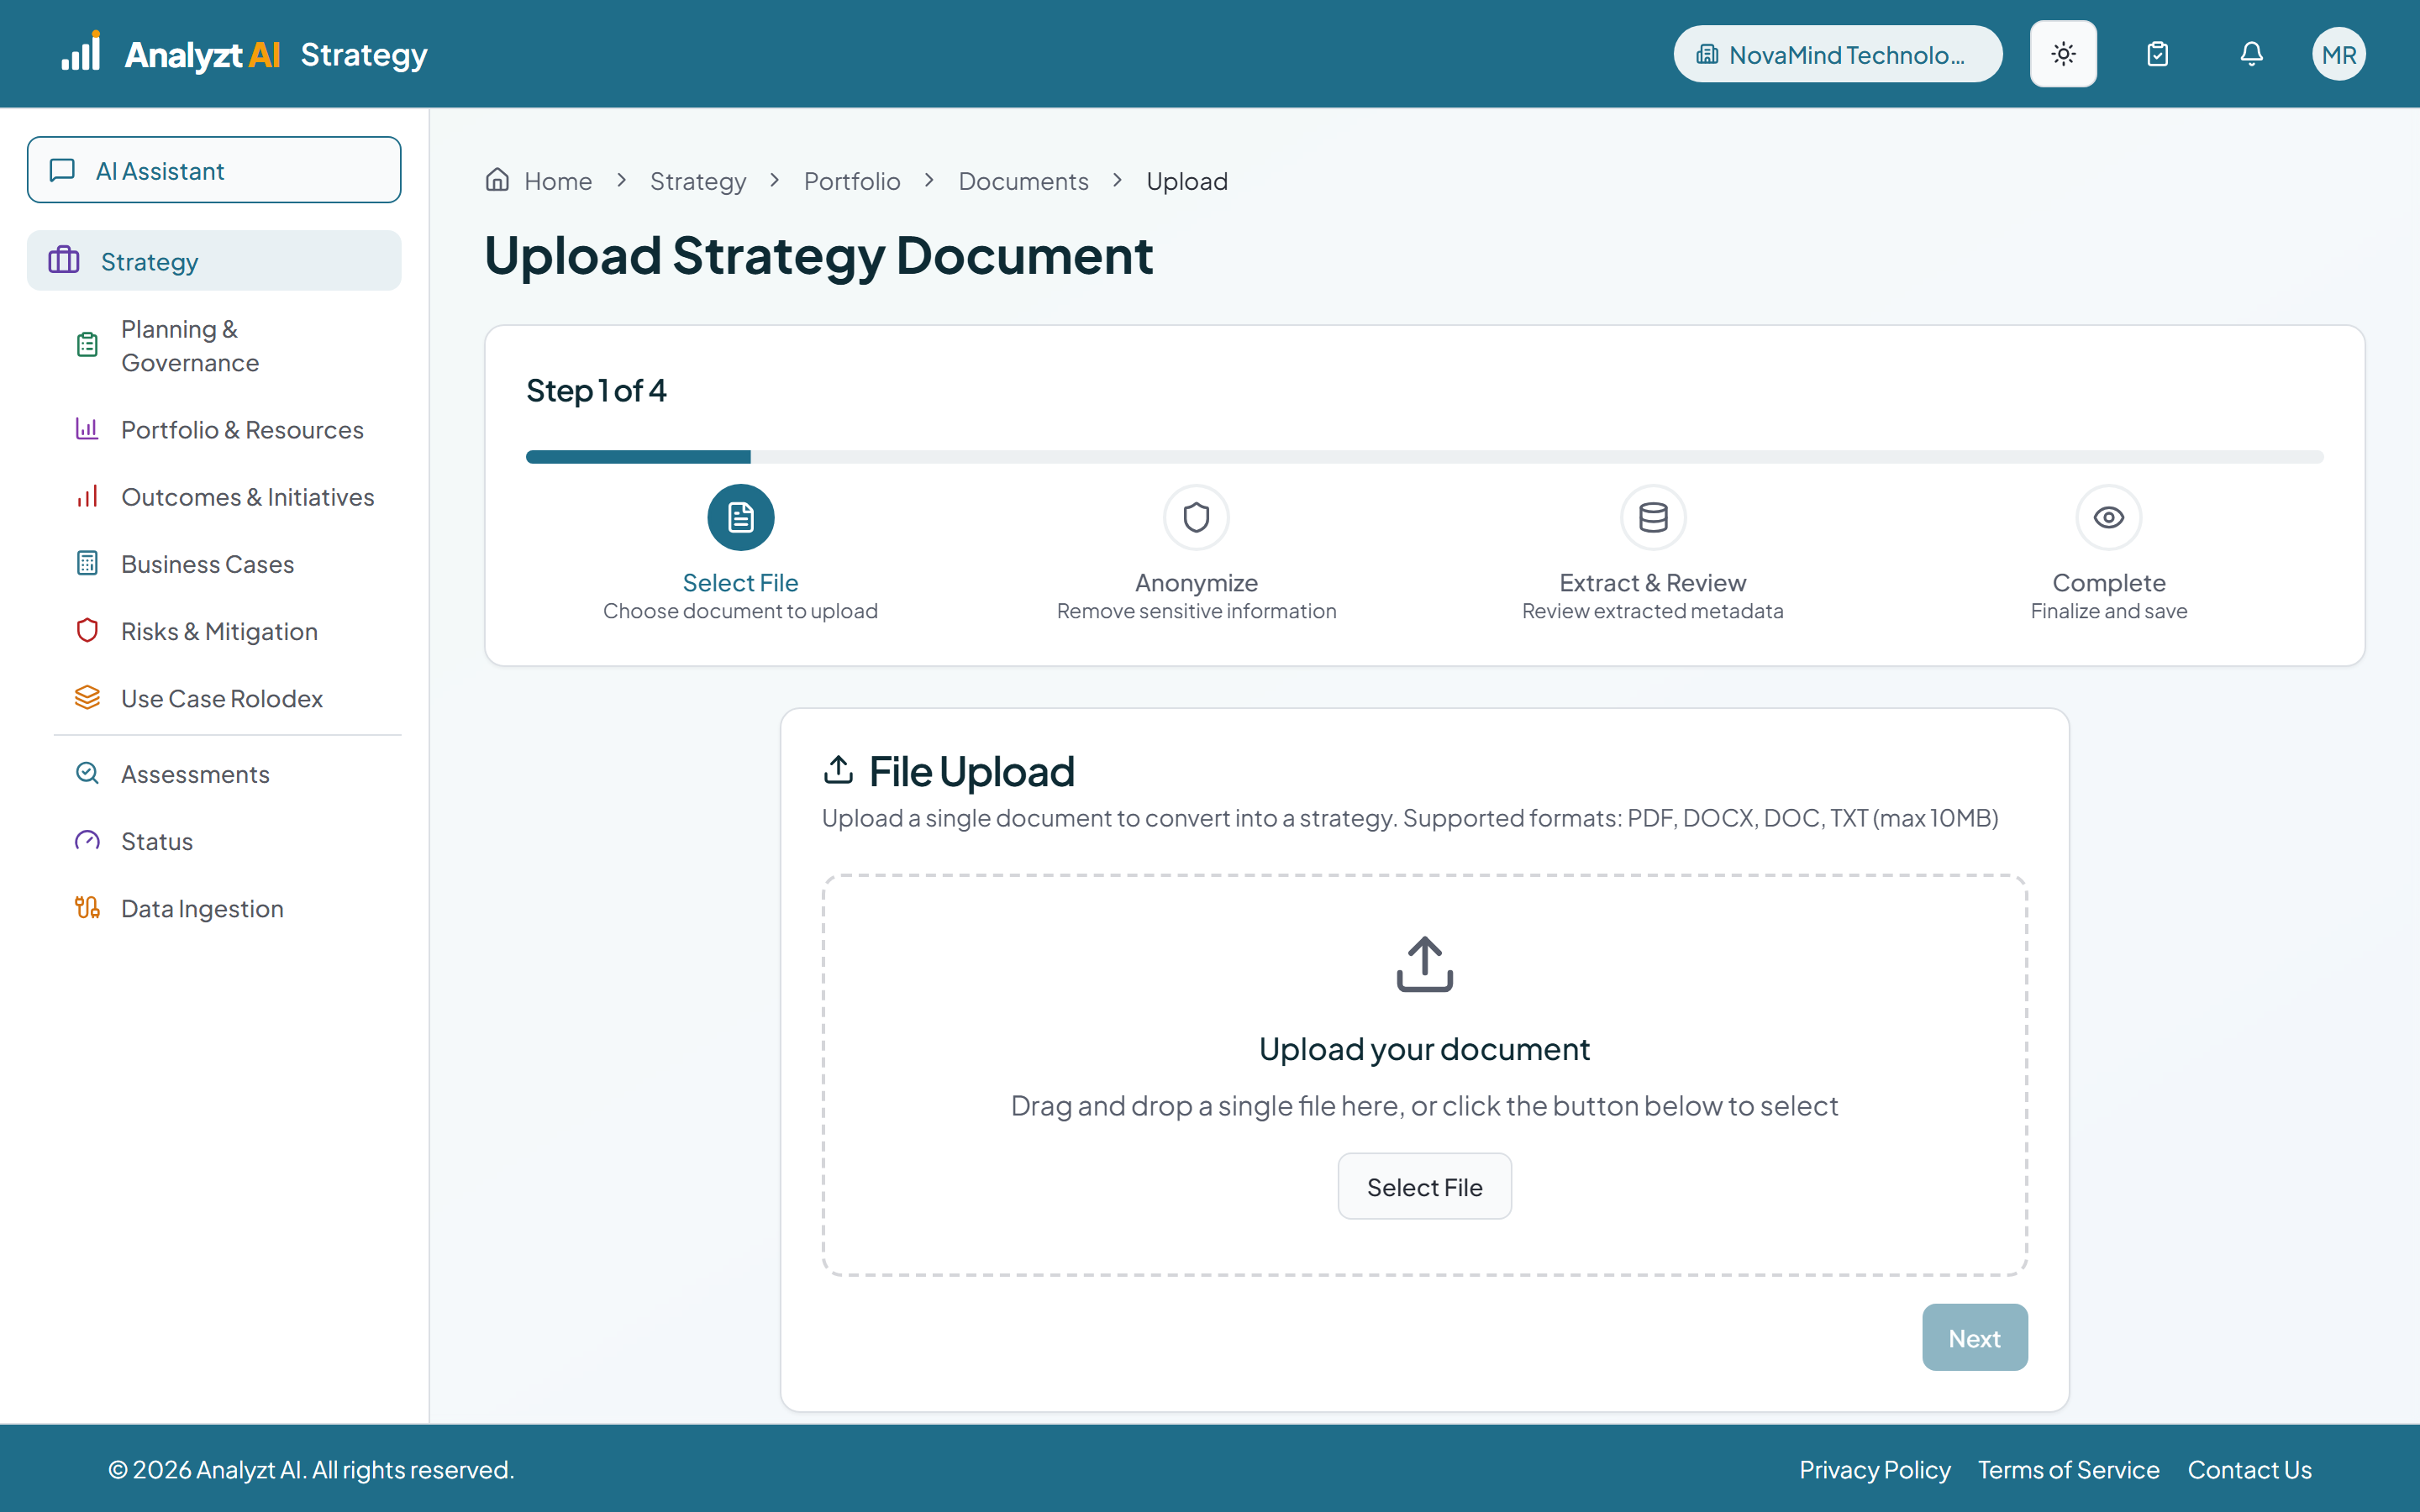
Drop In What You Have
Stop copying your strategy into a form. Upload the document you already have and review what the platform extracted before anything is saved.
 ~2 min
Strategy lead
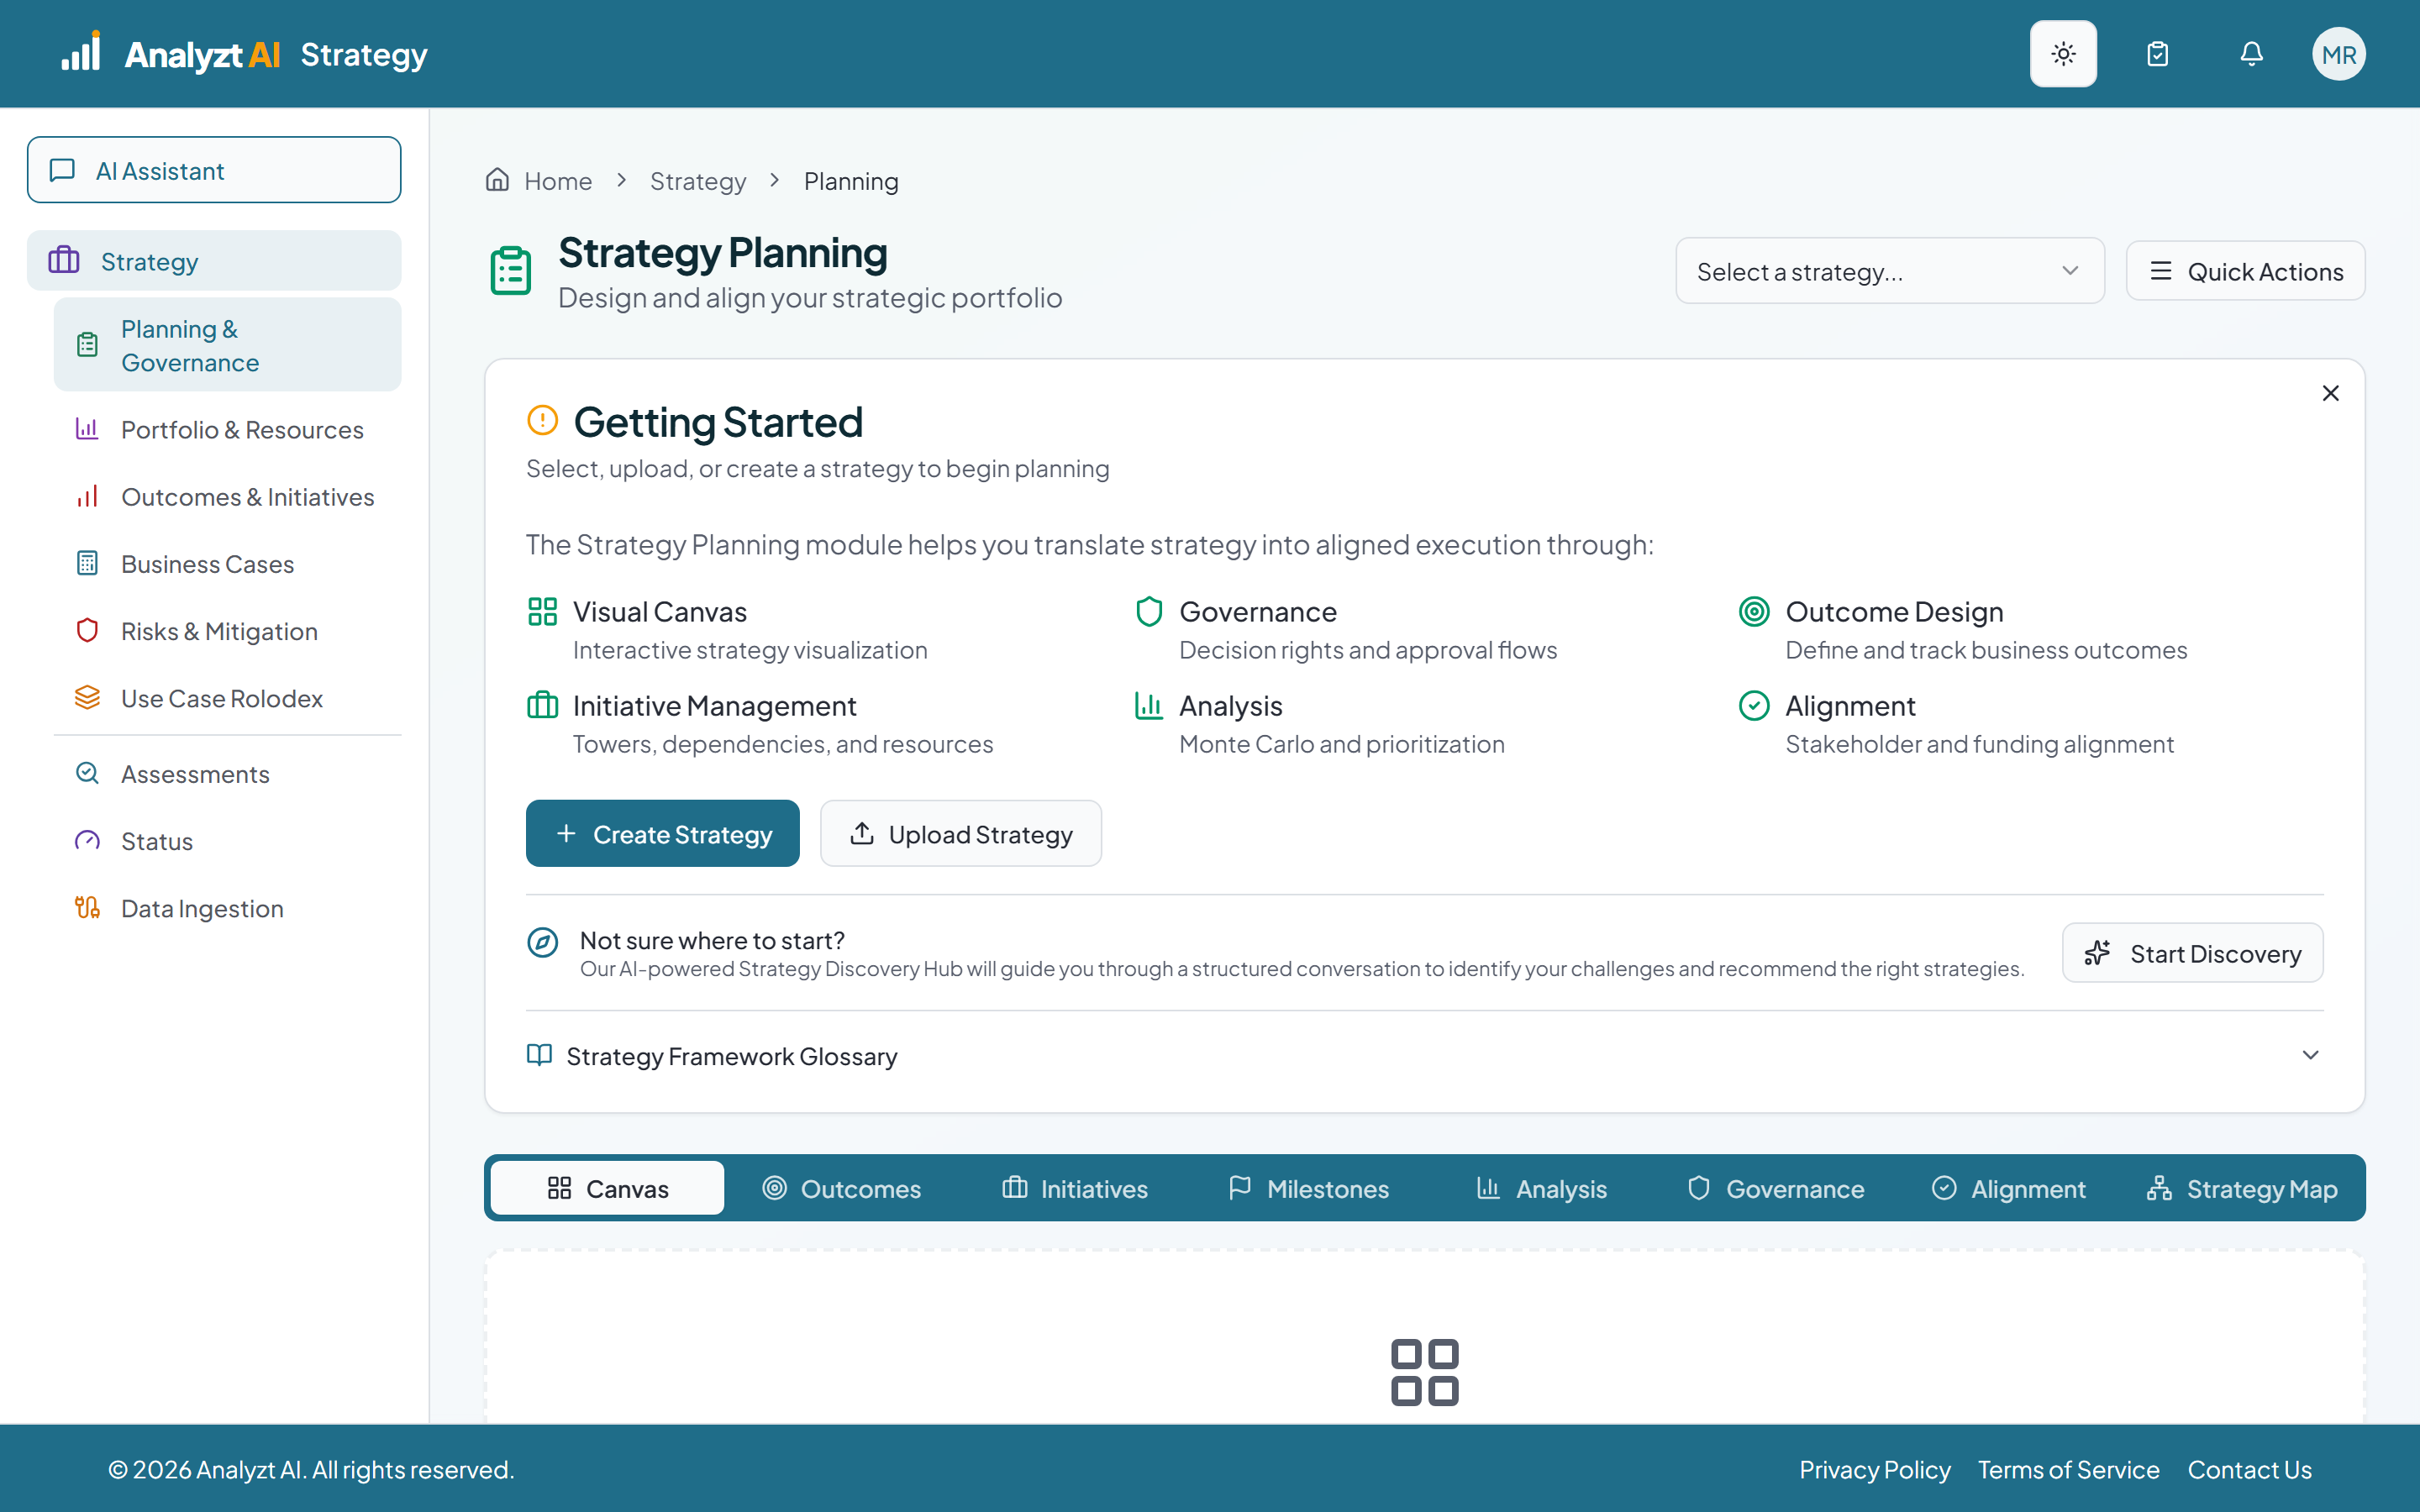
Start From a Template
Pick the closest starting point, let the platform fill in the strategy, then edit it into your own.
 ~1 min
Strategy lead
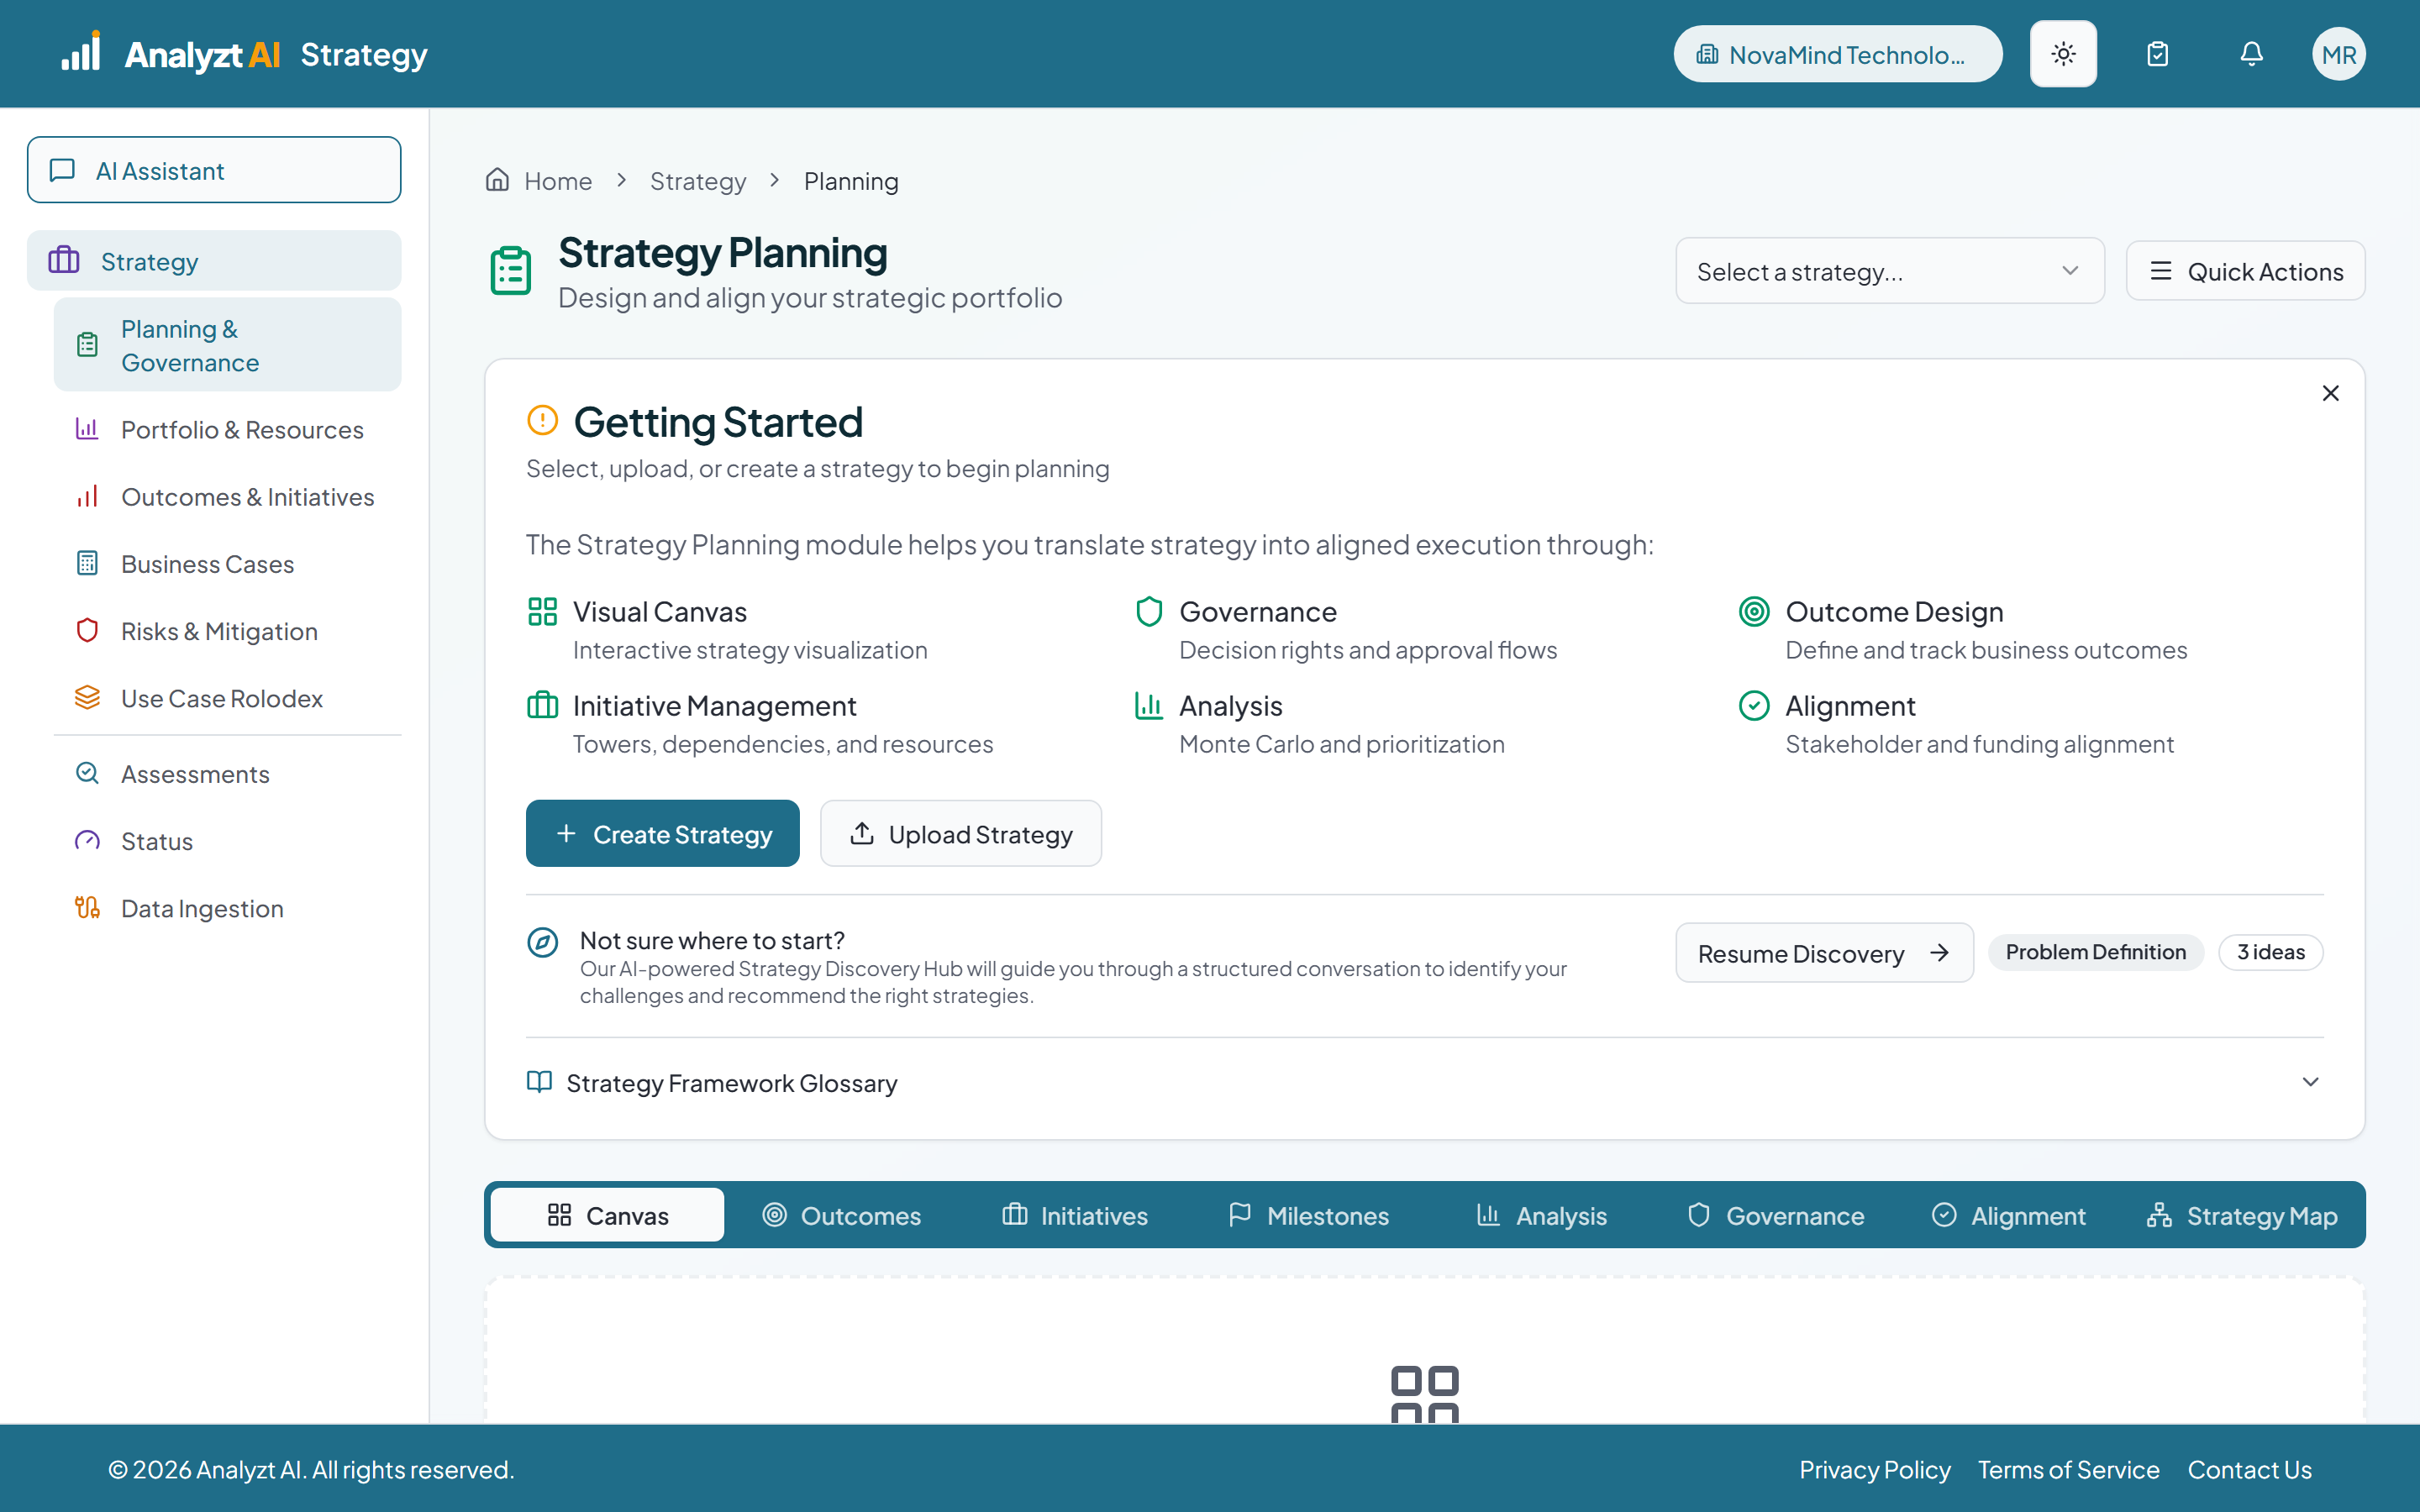
Create a Strategy With AI
No template, no document, nothing written down yet. Describe your organization and your intent in your own words, choose how it should read, and review what comes back before you publish.
 ~1 min
Strategy lead
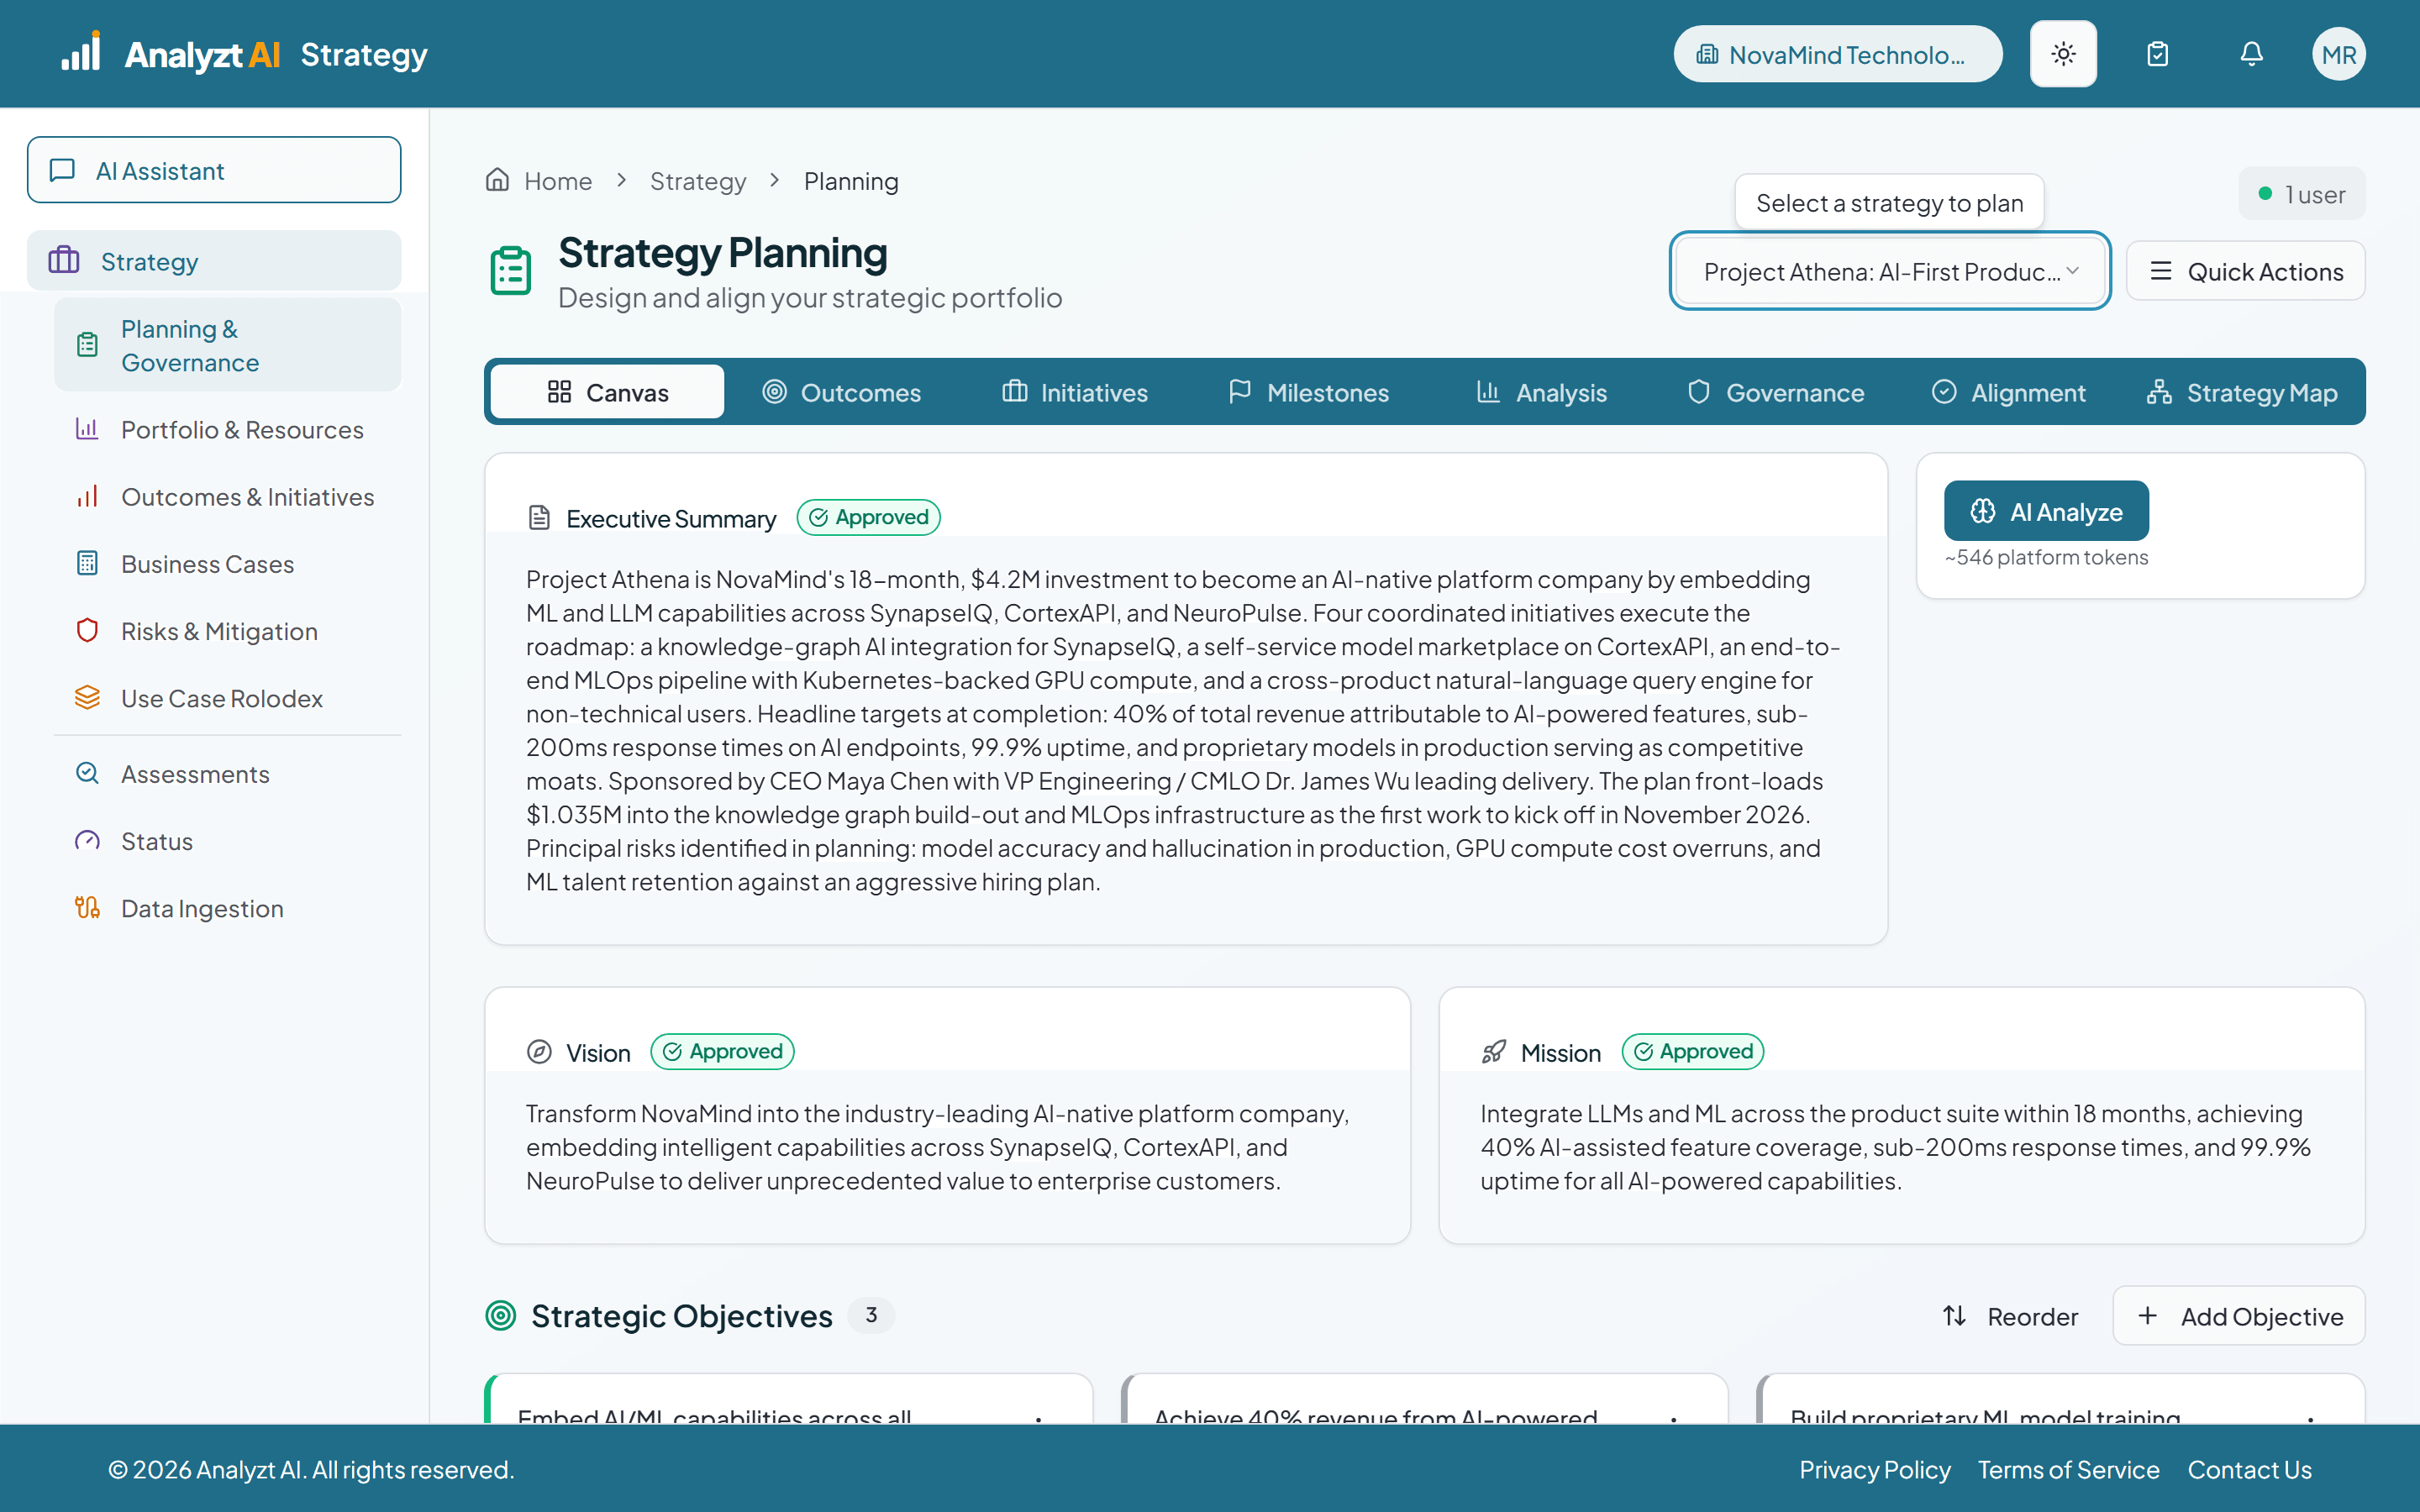
The Planning Canvas
Vision at the top, the work at the bottom, and a line you can trace between them. Objectives, outcomes, initiatives and milestones in one place.
 ~1 min
Strategy lead
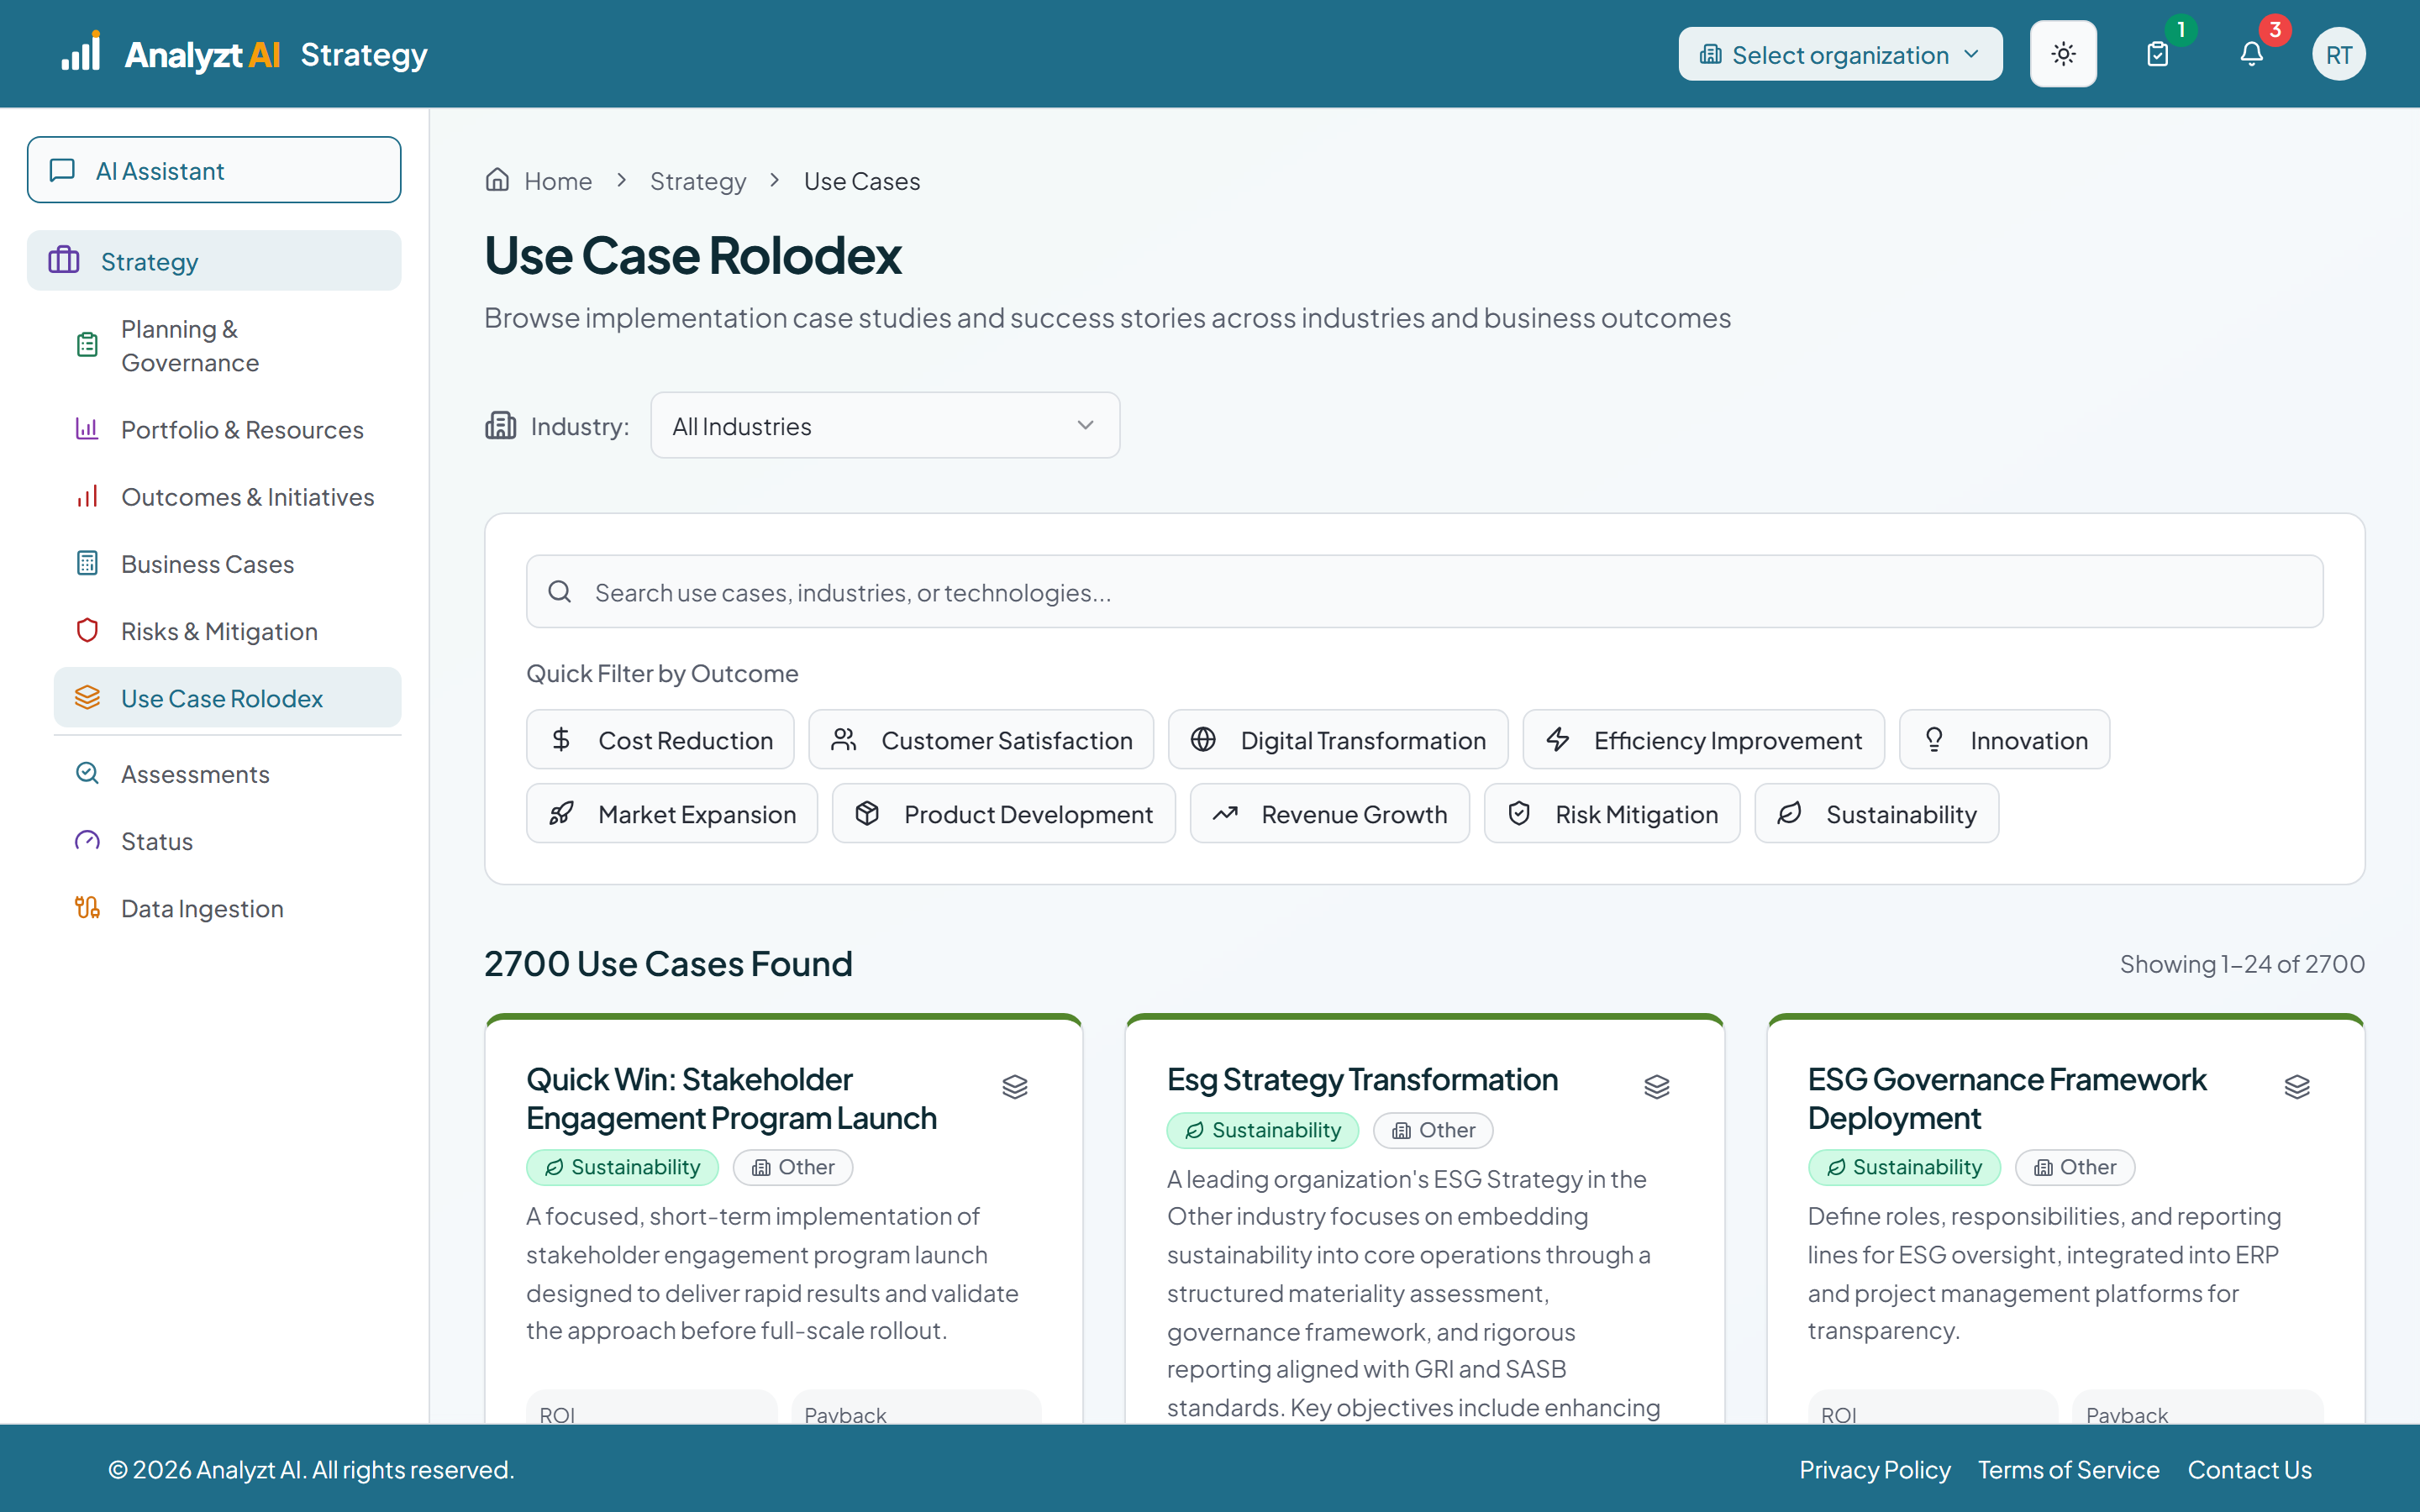
Proven Use Cases
A library of implementation case studies, opened already filtered to your industry. Open one for the problem it solved, the approach and the measured results, then add it to a strategy or start a new one from it.
 ~1 min
Strategy lead · Executive
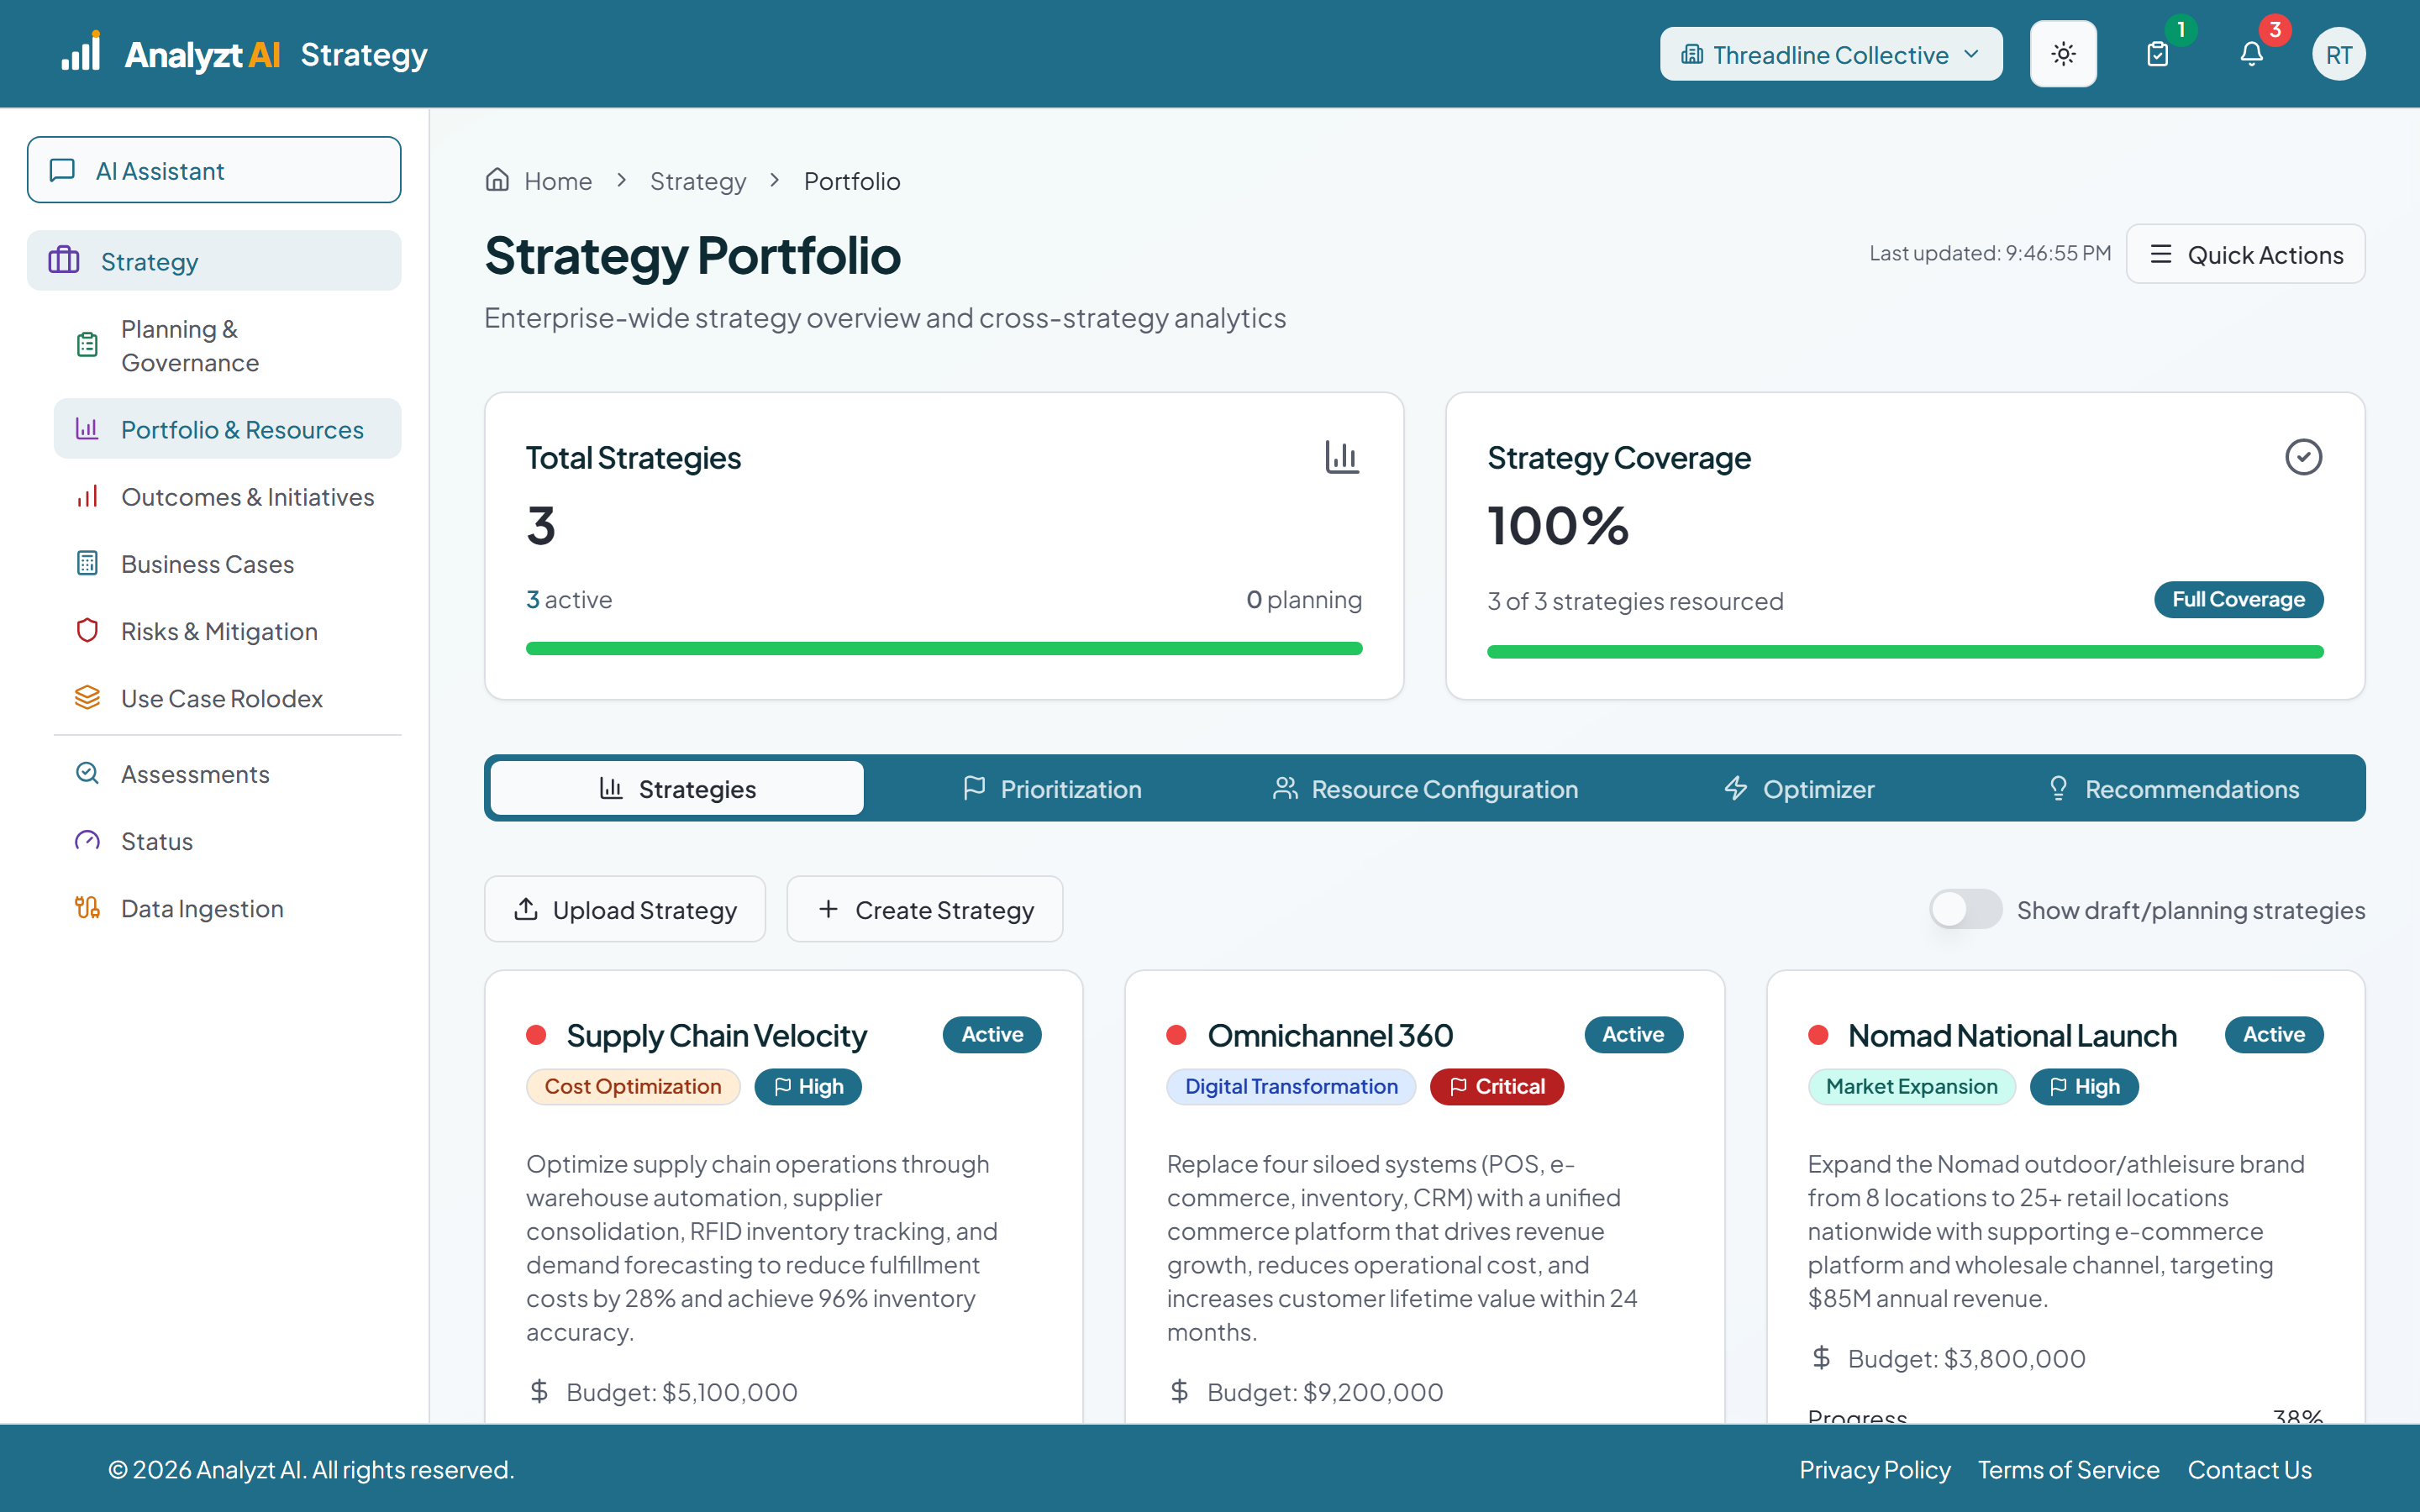
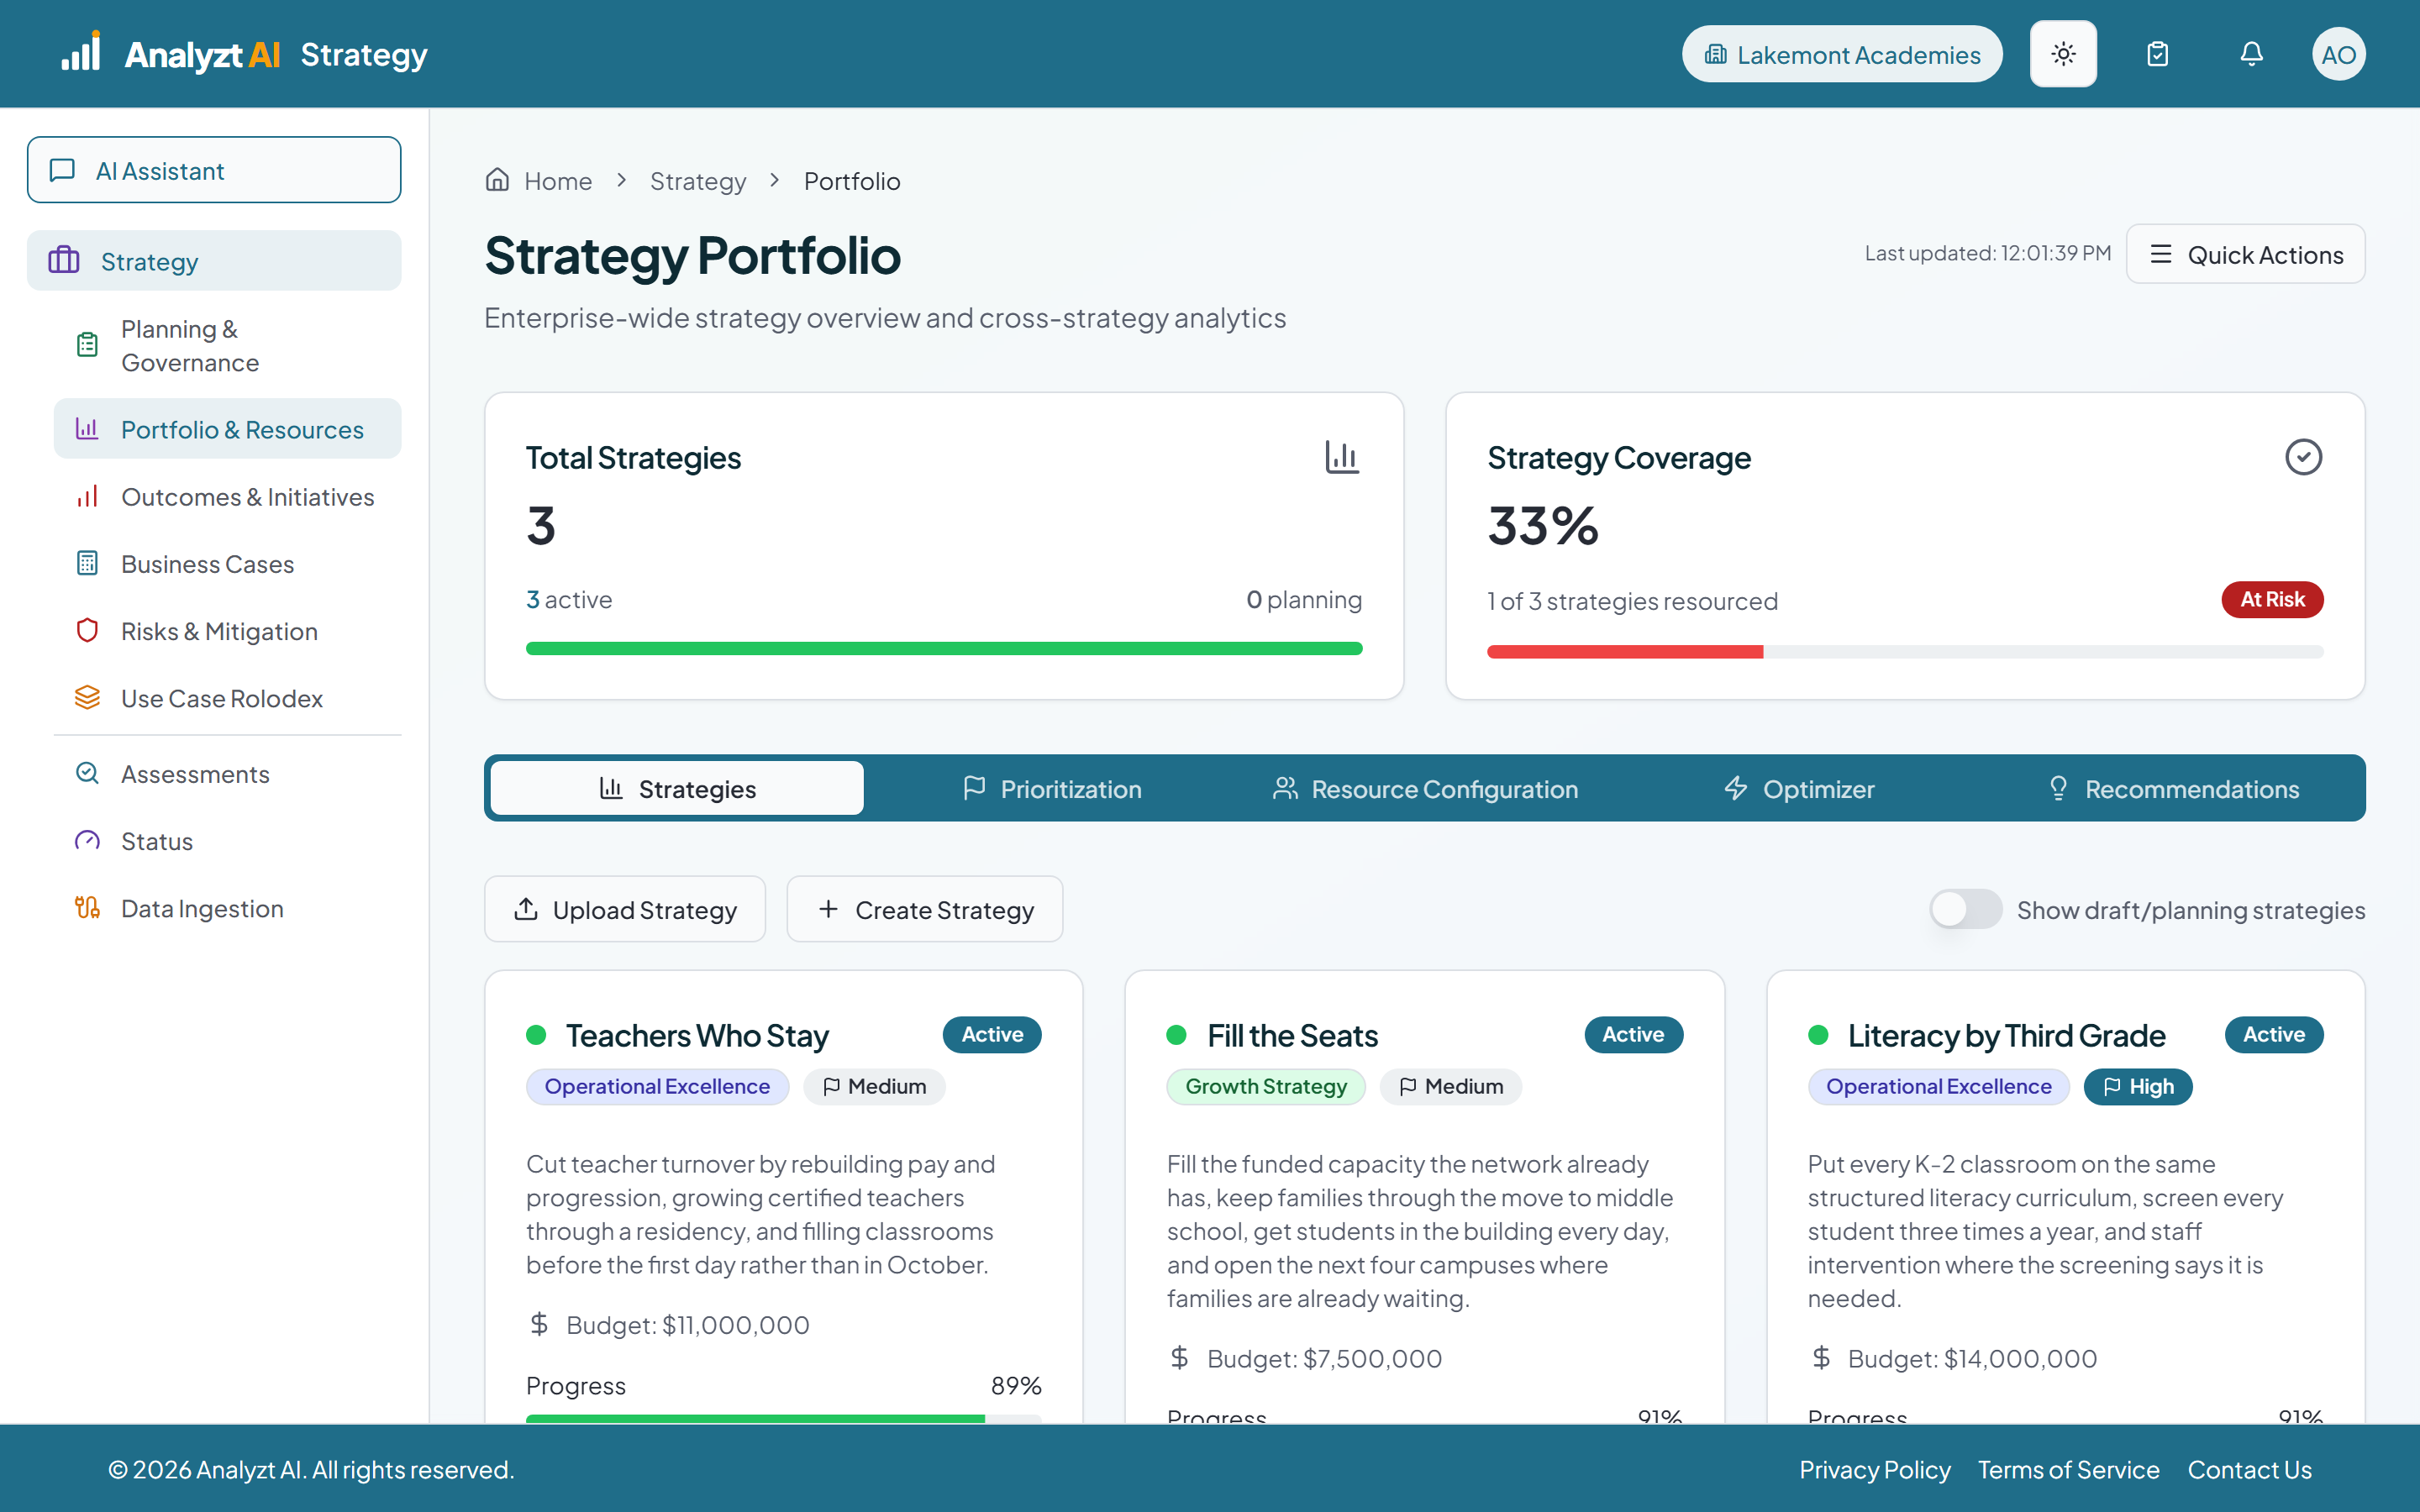
Portfolio and Resources
See every strategy competing for the same budget and the same teams, then optimize across the whole portfolio rather than one plan at a time.
 ~2 min
Strategy lead · Executive
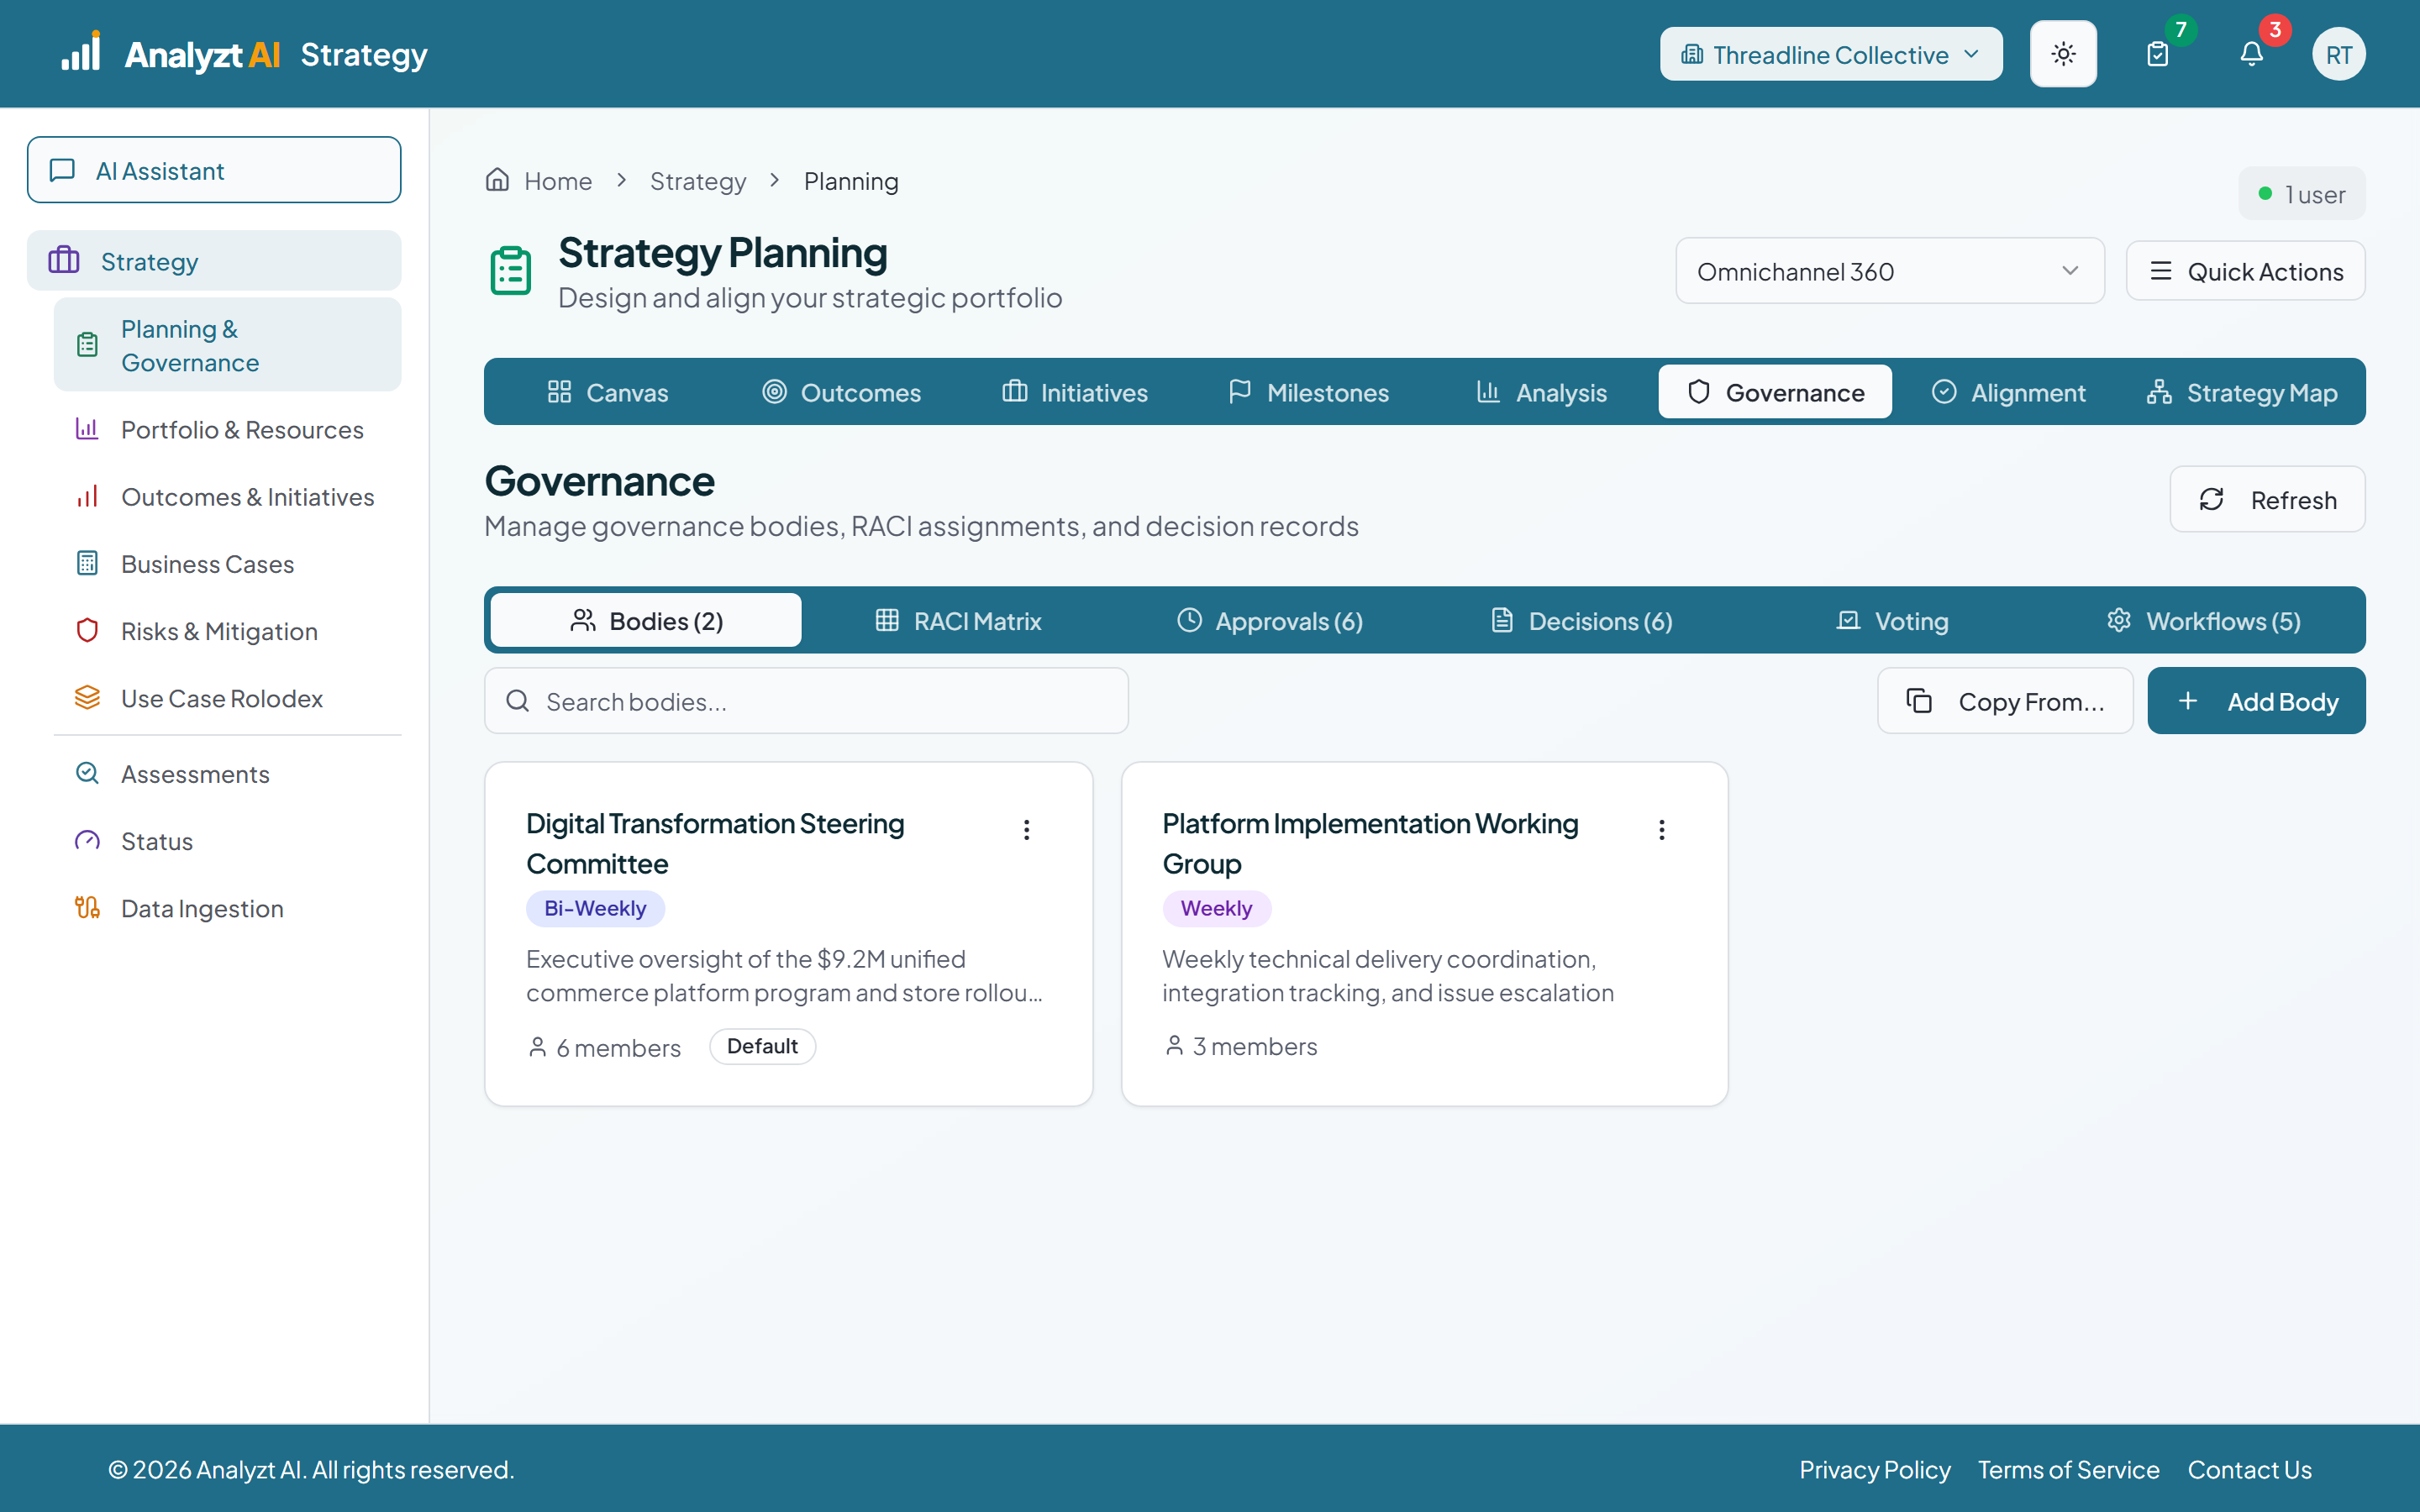
Who Decides, and How
Governance bodies with cadence and members, a RACI matrix for every initiative, a decision log with the rationale kept on each entry, an approval queue, voting sessions with quorum and threshold, and the workflows every approval follows.
 ~1 min
Executive · Strategy lead
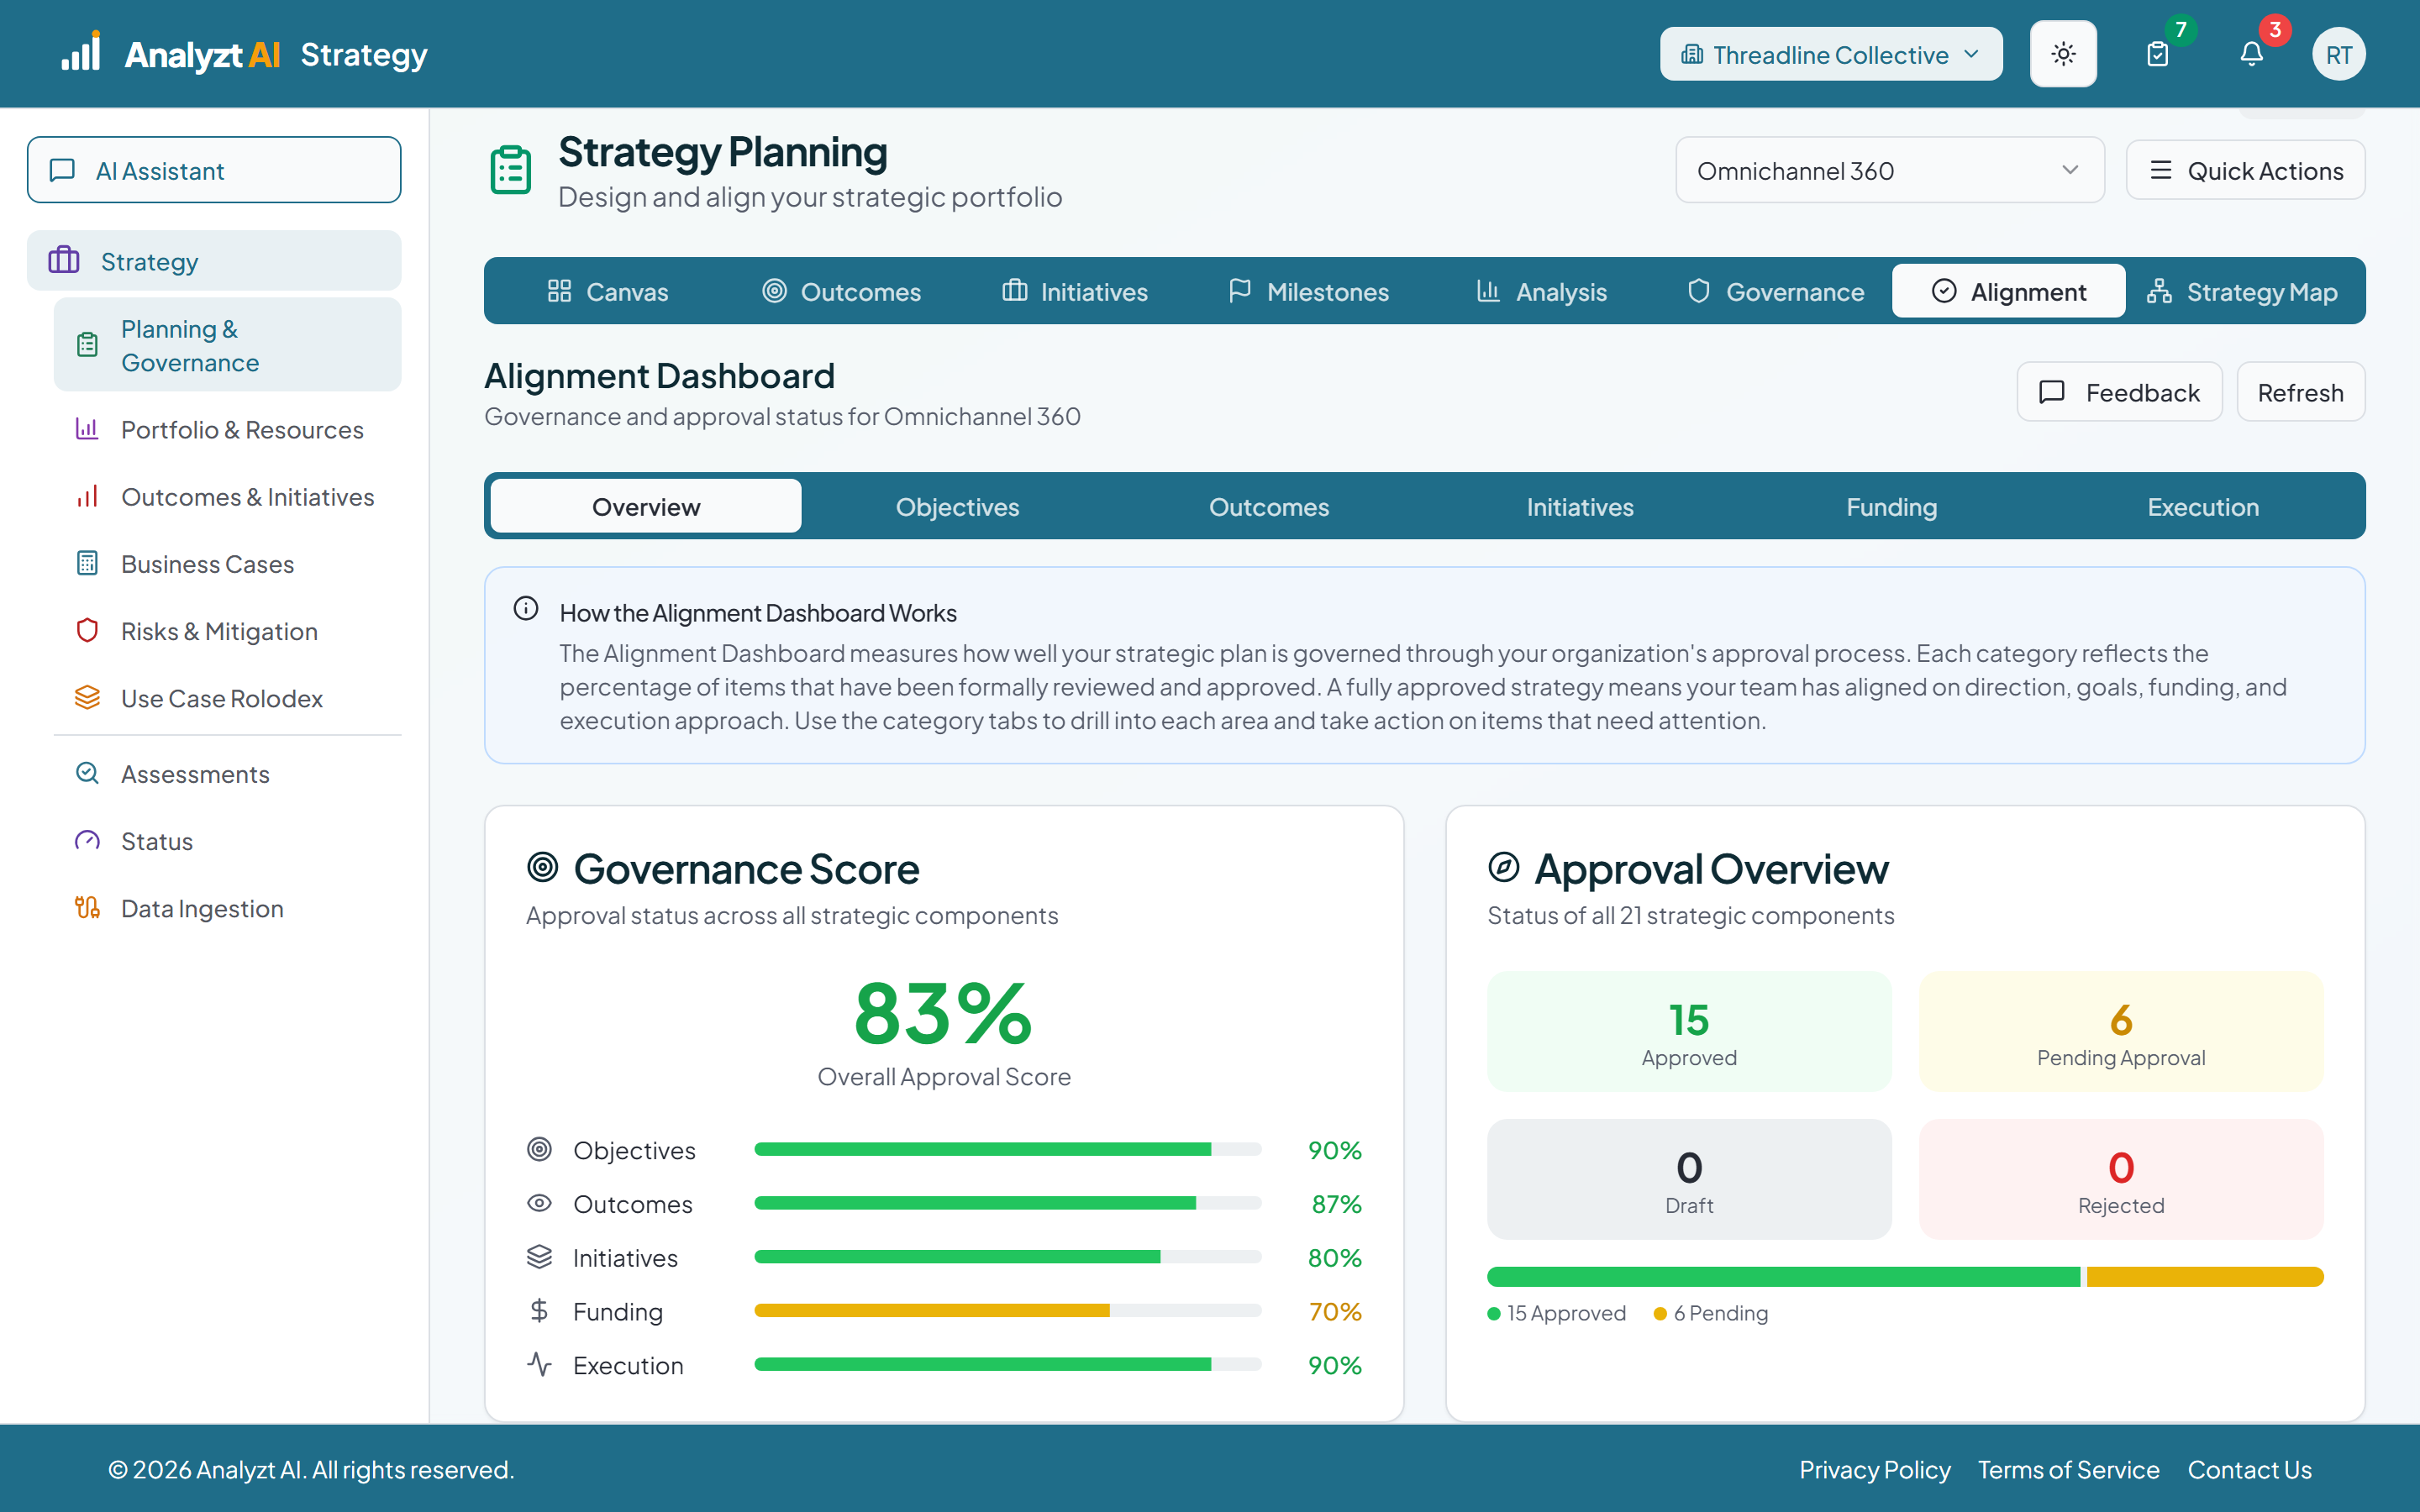
How Aligned Is the Plan
One governance score for the strategy, the share of objectives, outcomes, initiatives, funding and execution structure that has been formally approved, with the pending items named on each tab and feedback kept beside the numbers.
Analysis
Analysis turns an initiative into a business case with a financial model behind it. Seven models are available and the wizard asks only for what the selected model needs. The platform returns scenarios, a distribution and named risks, and the approval workflow records who decided what. Assessments answer standing executive questions from the same data.
11 demos
about 17 min
 ~2 min
Finance · Strategy lead
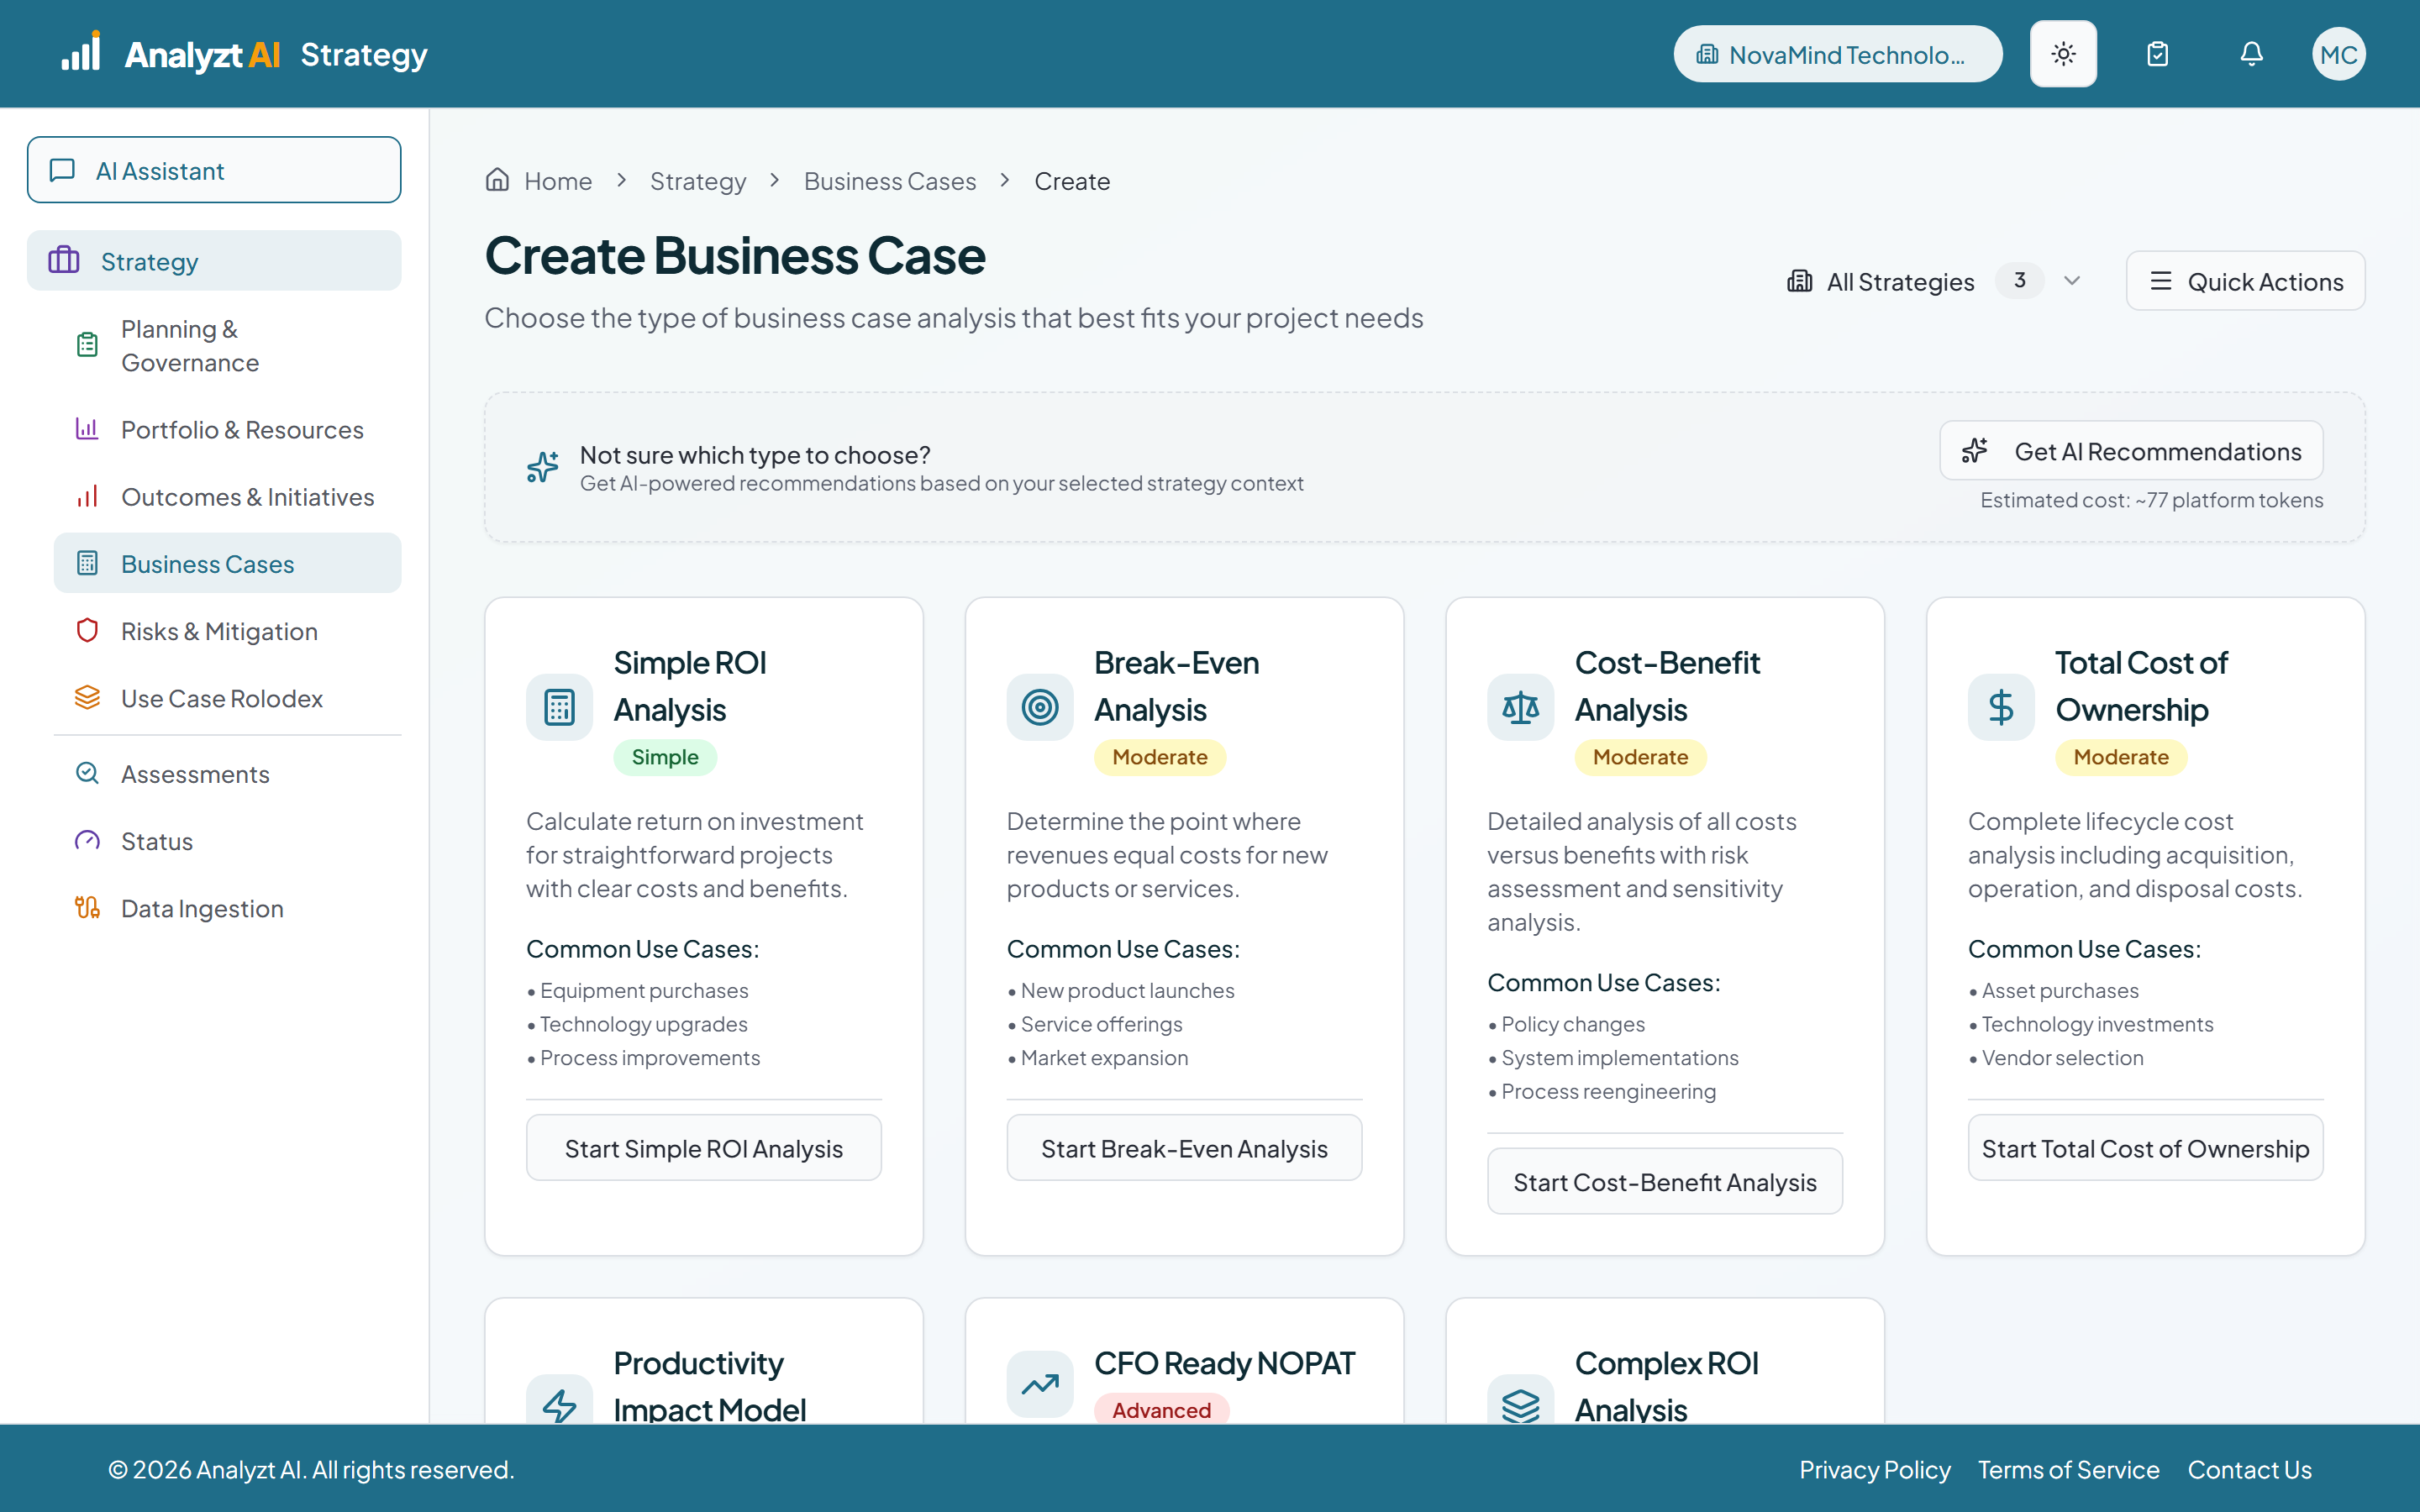
Build a Business Case in Six Fields
Seven financial models, because buying equipment and launching a product are not the same question. Simple ROI asks for an investment, an annual benefit, a period and a rate, then returns ROI, NPV and payback, runs the models and states the decision with its gates.
 ~1 min
Finance · Executive
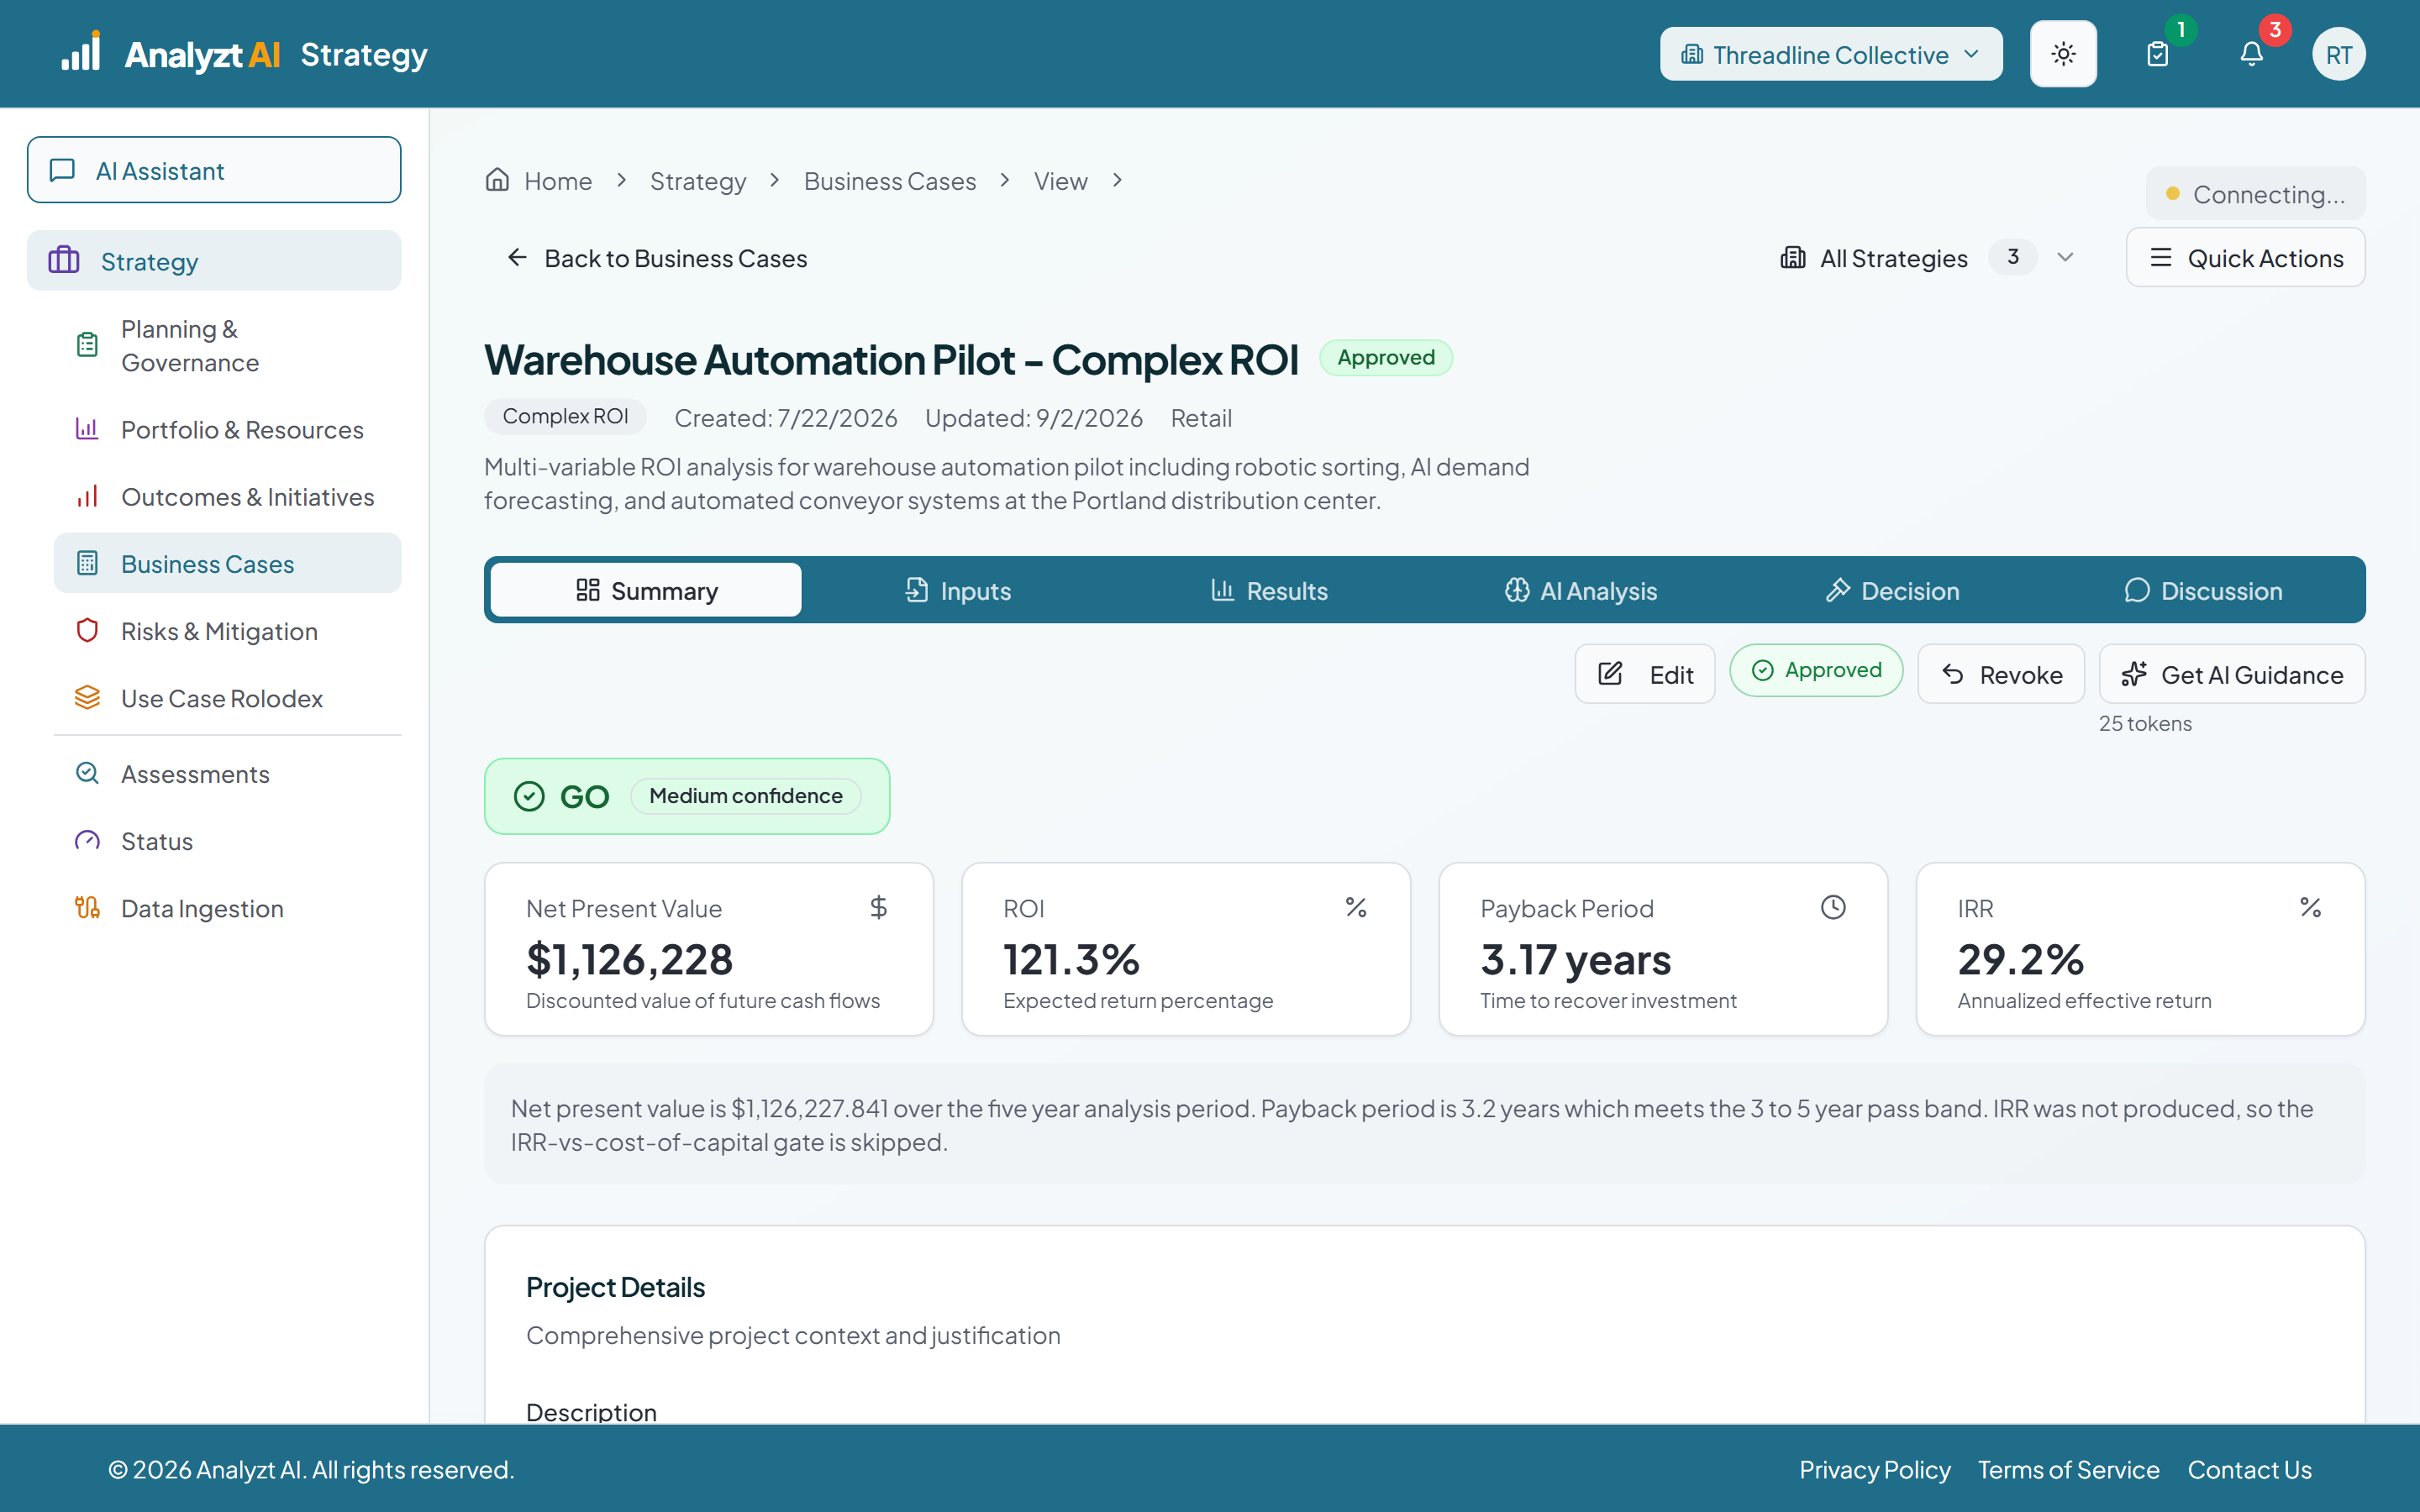
Read the Analysis, Make the Call
Open a finished case and read what the platform made of it. Scenarios beside the headline figure, a Monte Carlo distribution rather than a single number, named risks with their mitigations, and a recommendation that says plainly what it could not calculate.
 ~1 min
Executive · Finance
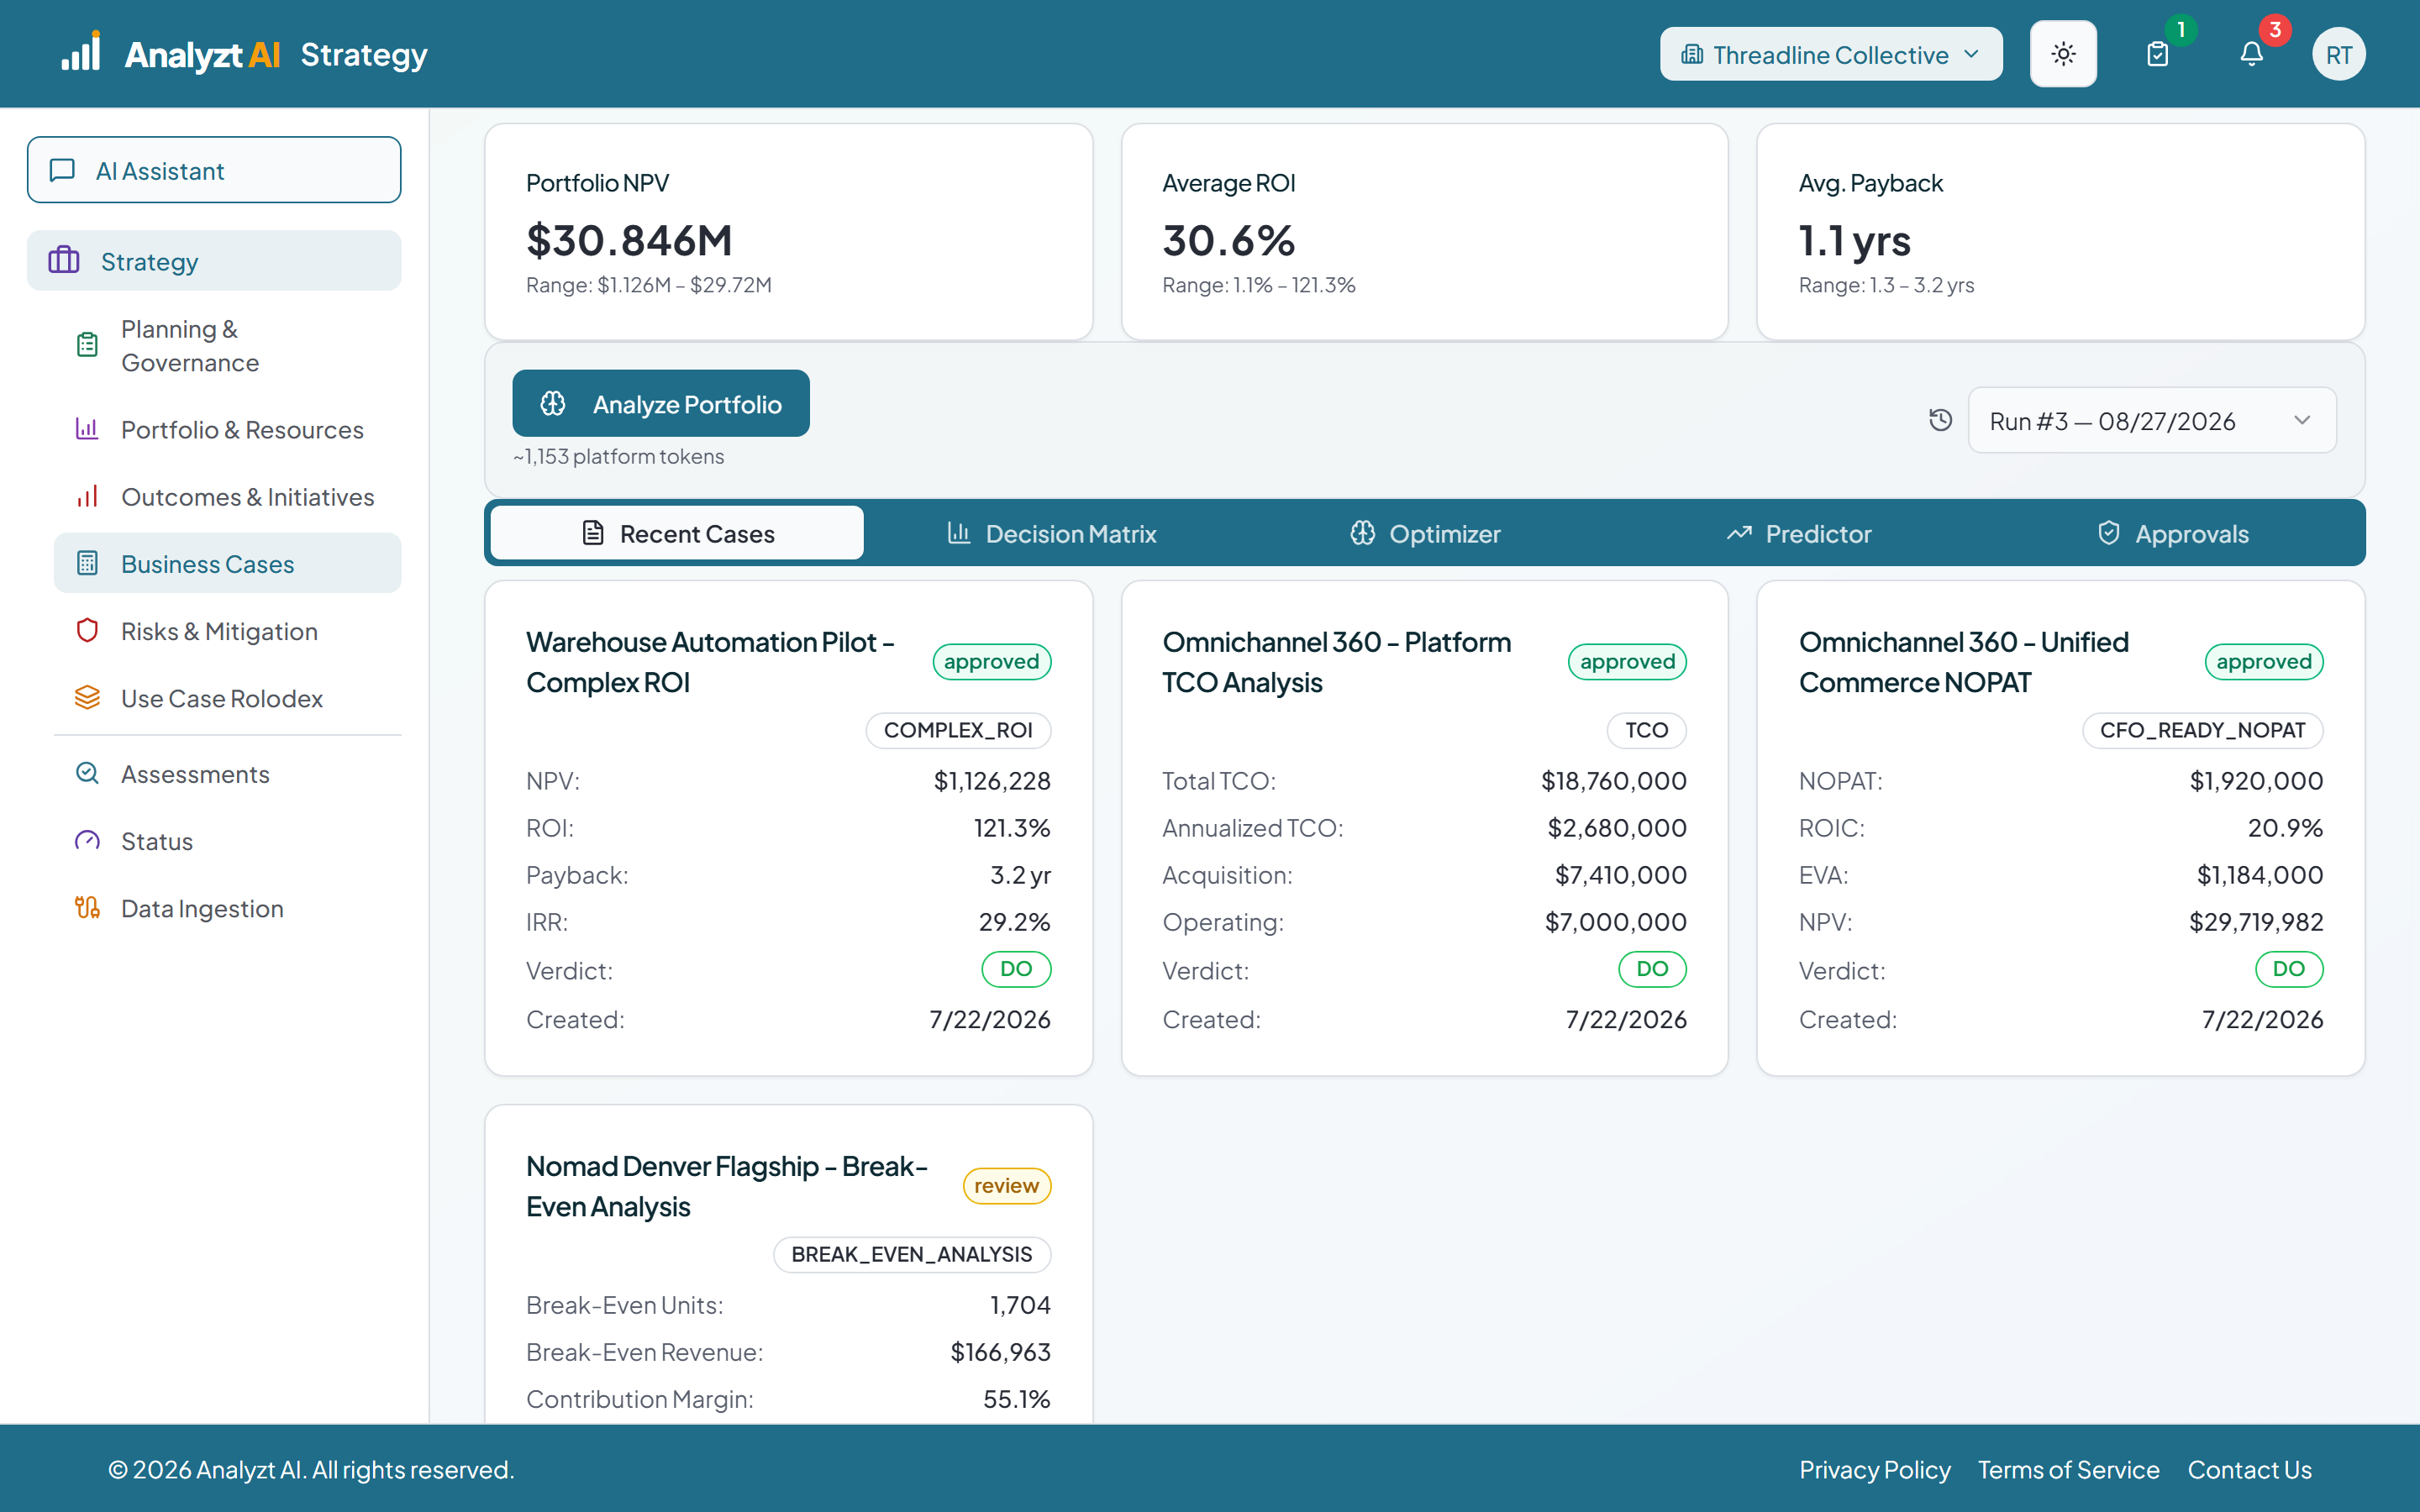
Getting a Business Case Approved
Who owes a decision, on what, and how long it has been waiting. The discussion thread carries the reasoning and the buttons only record the outcome.
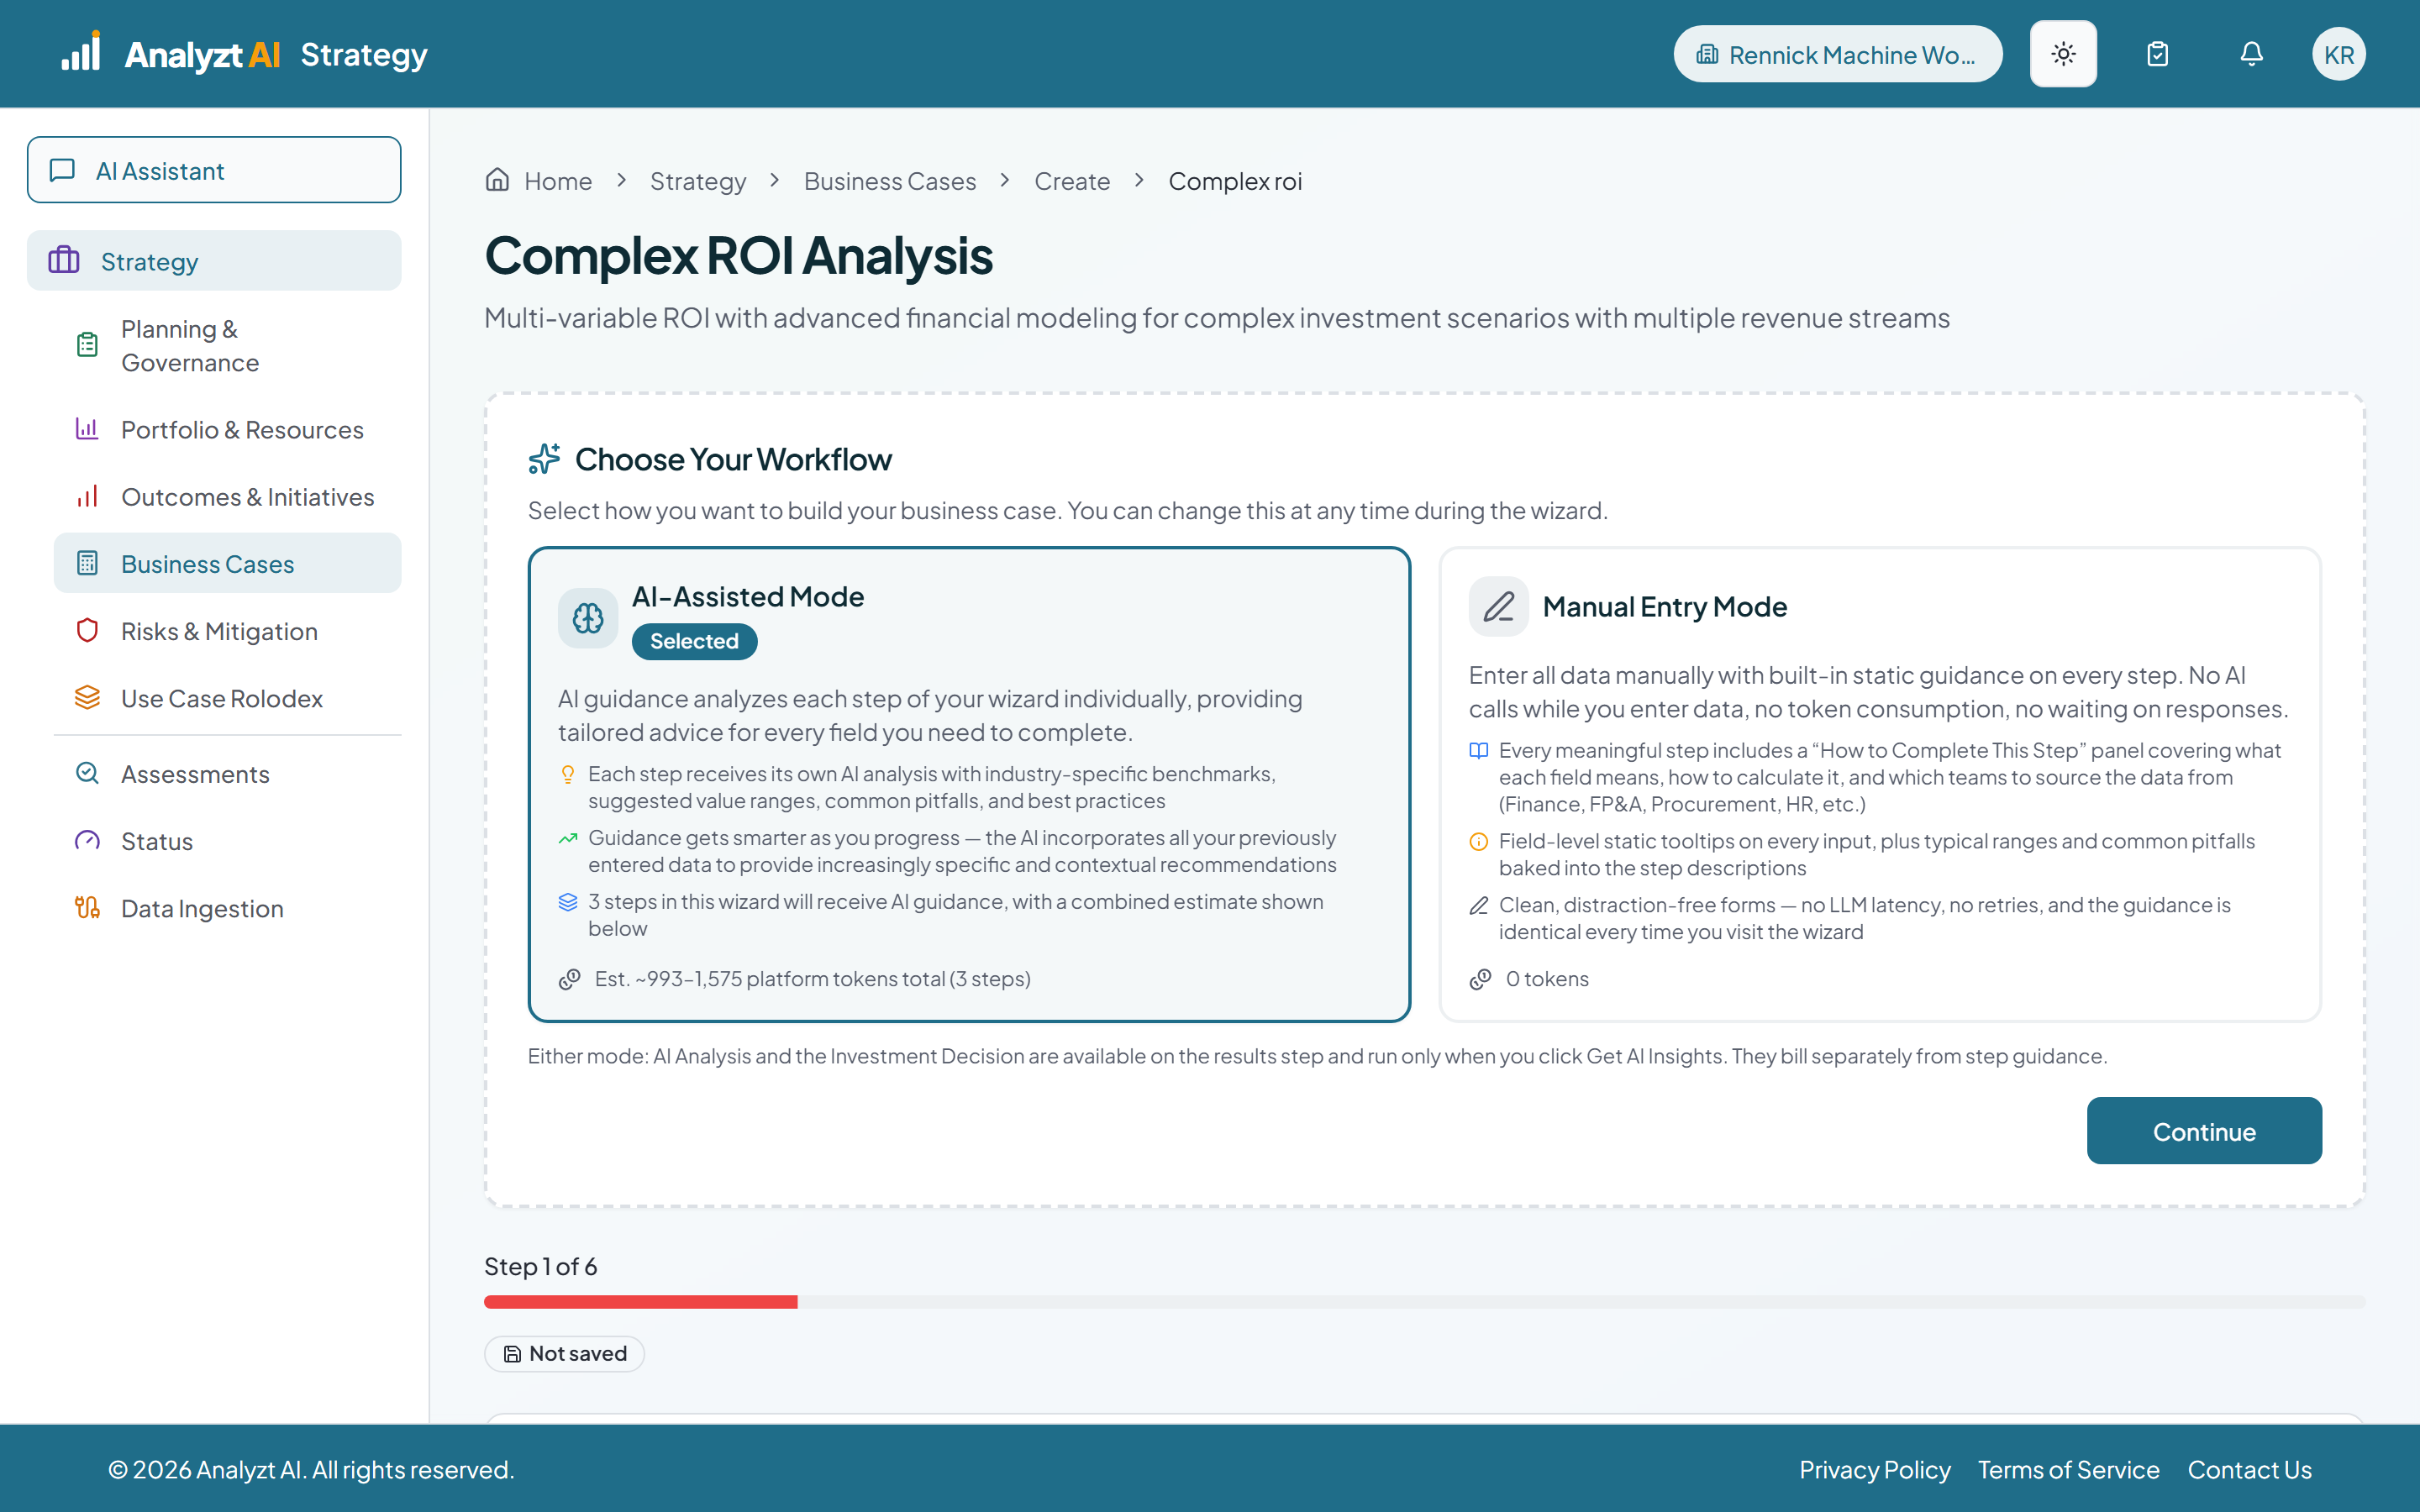 ~2 min
Finance · Strategy lead
Complex ROI, Year by Year
Benefits and operating costs entered for every year rather than one number repeated, then MIRR, profitability index and the option values on top of NPV and payback. Run AI Prediction returns the model view, the Monte Carlo and the risk read, and the review step carries the decision with its gates.
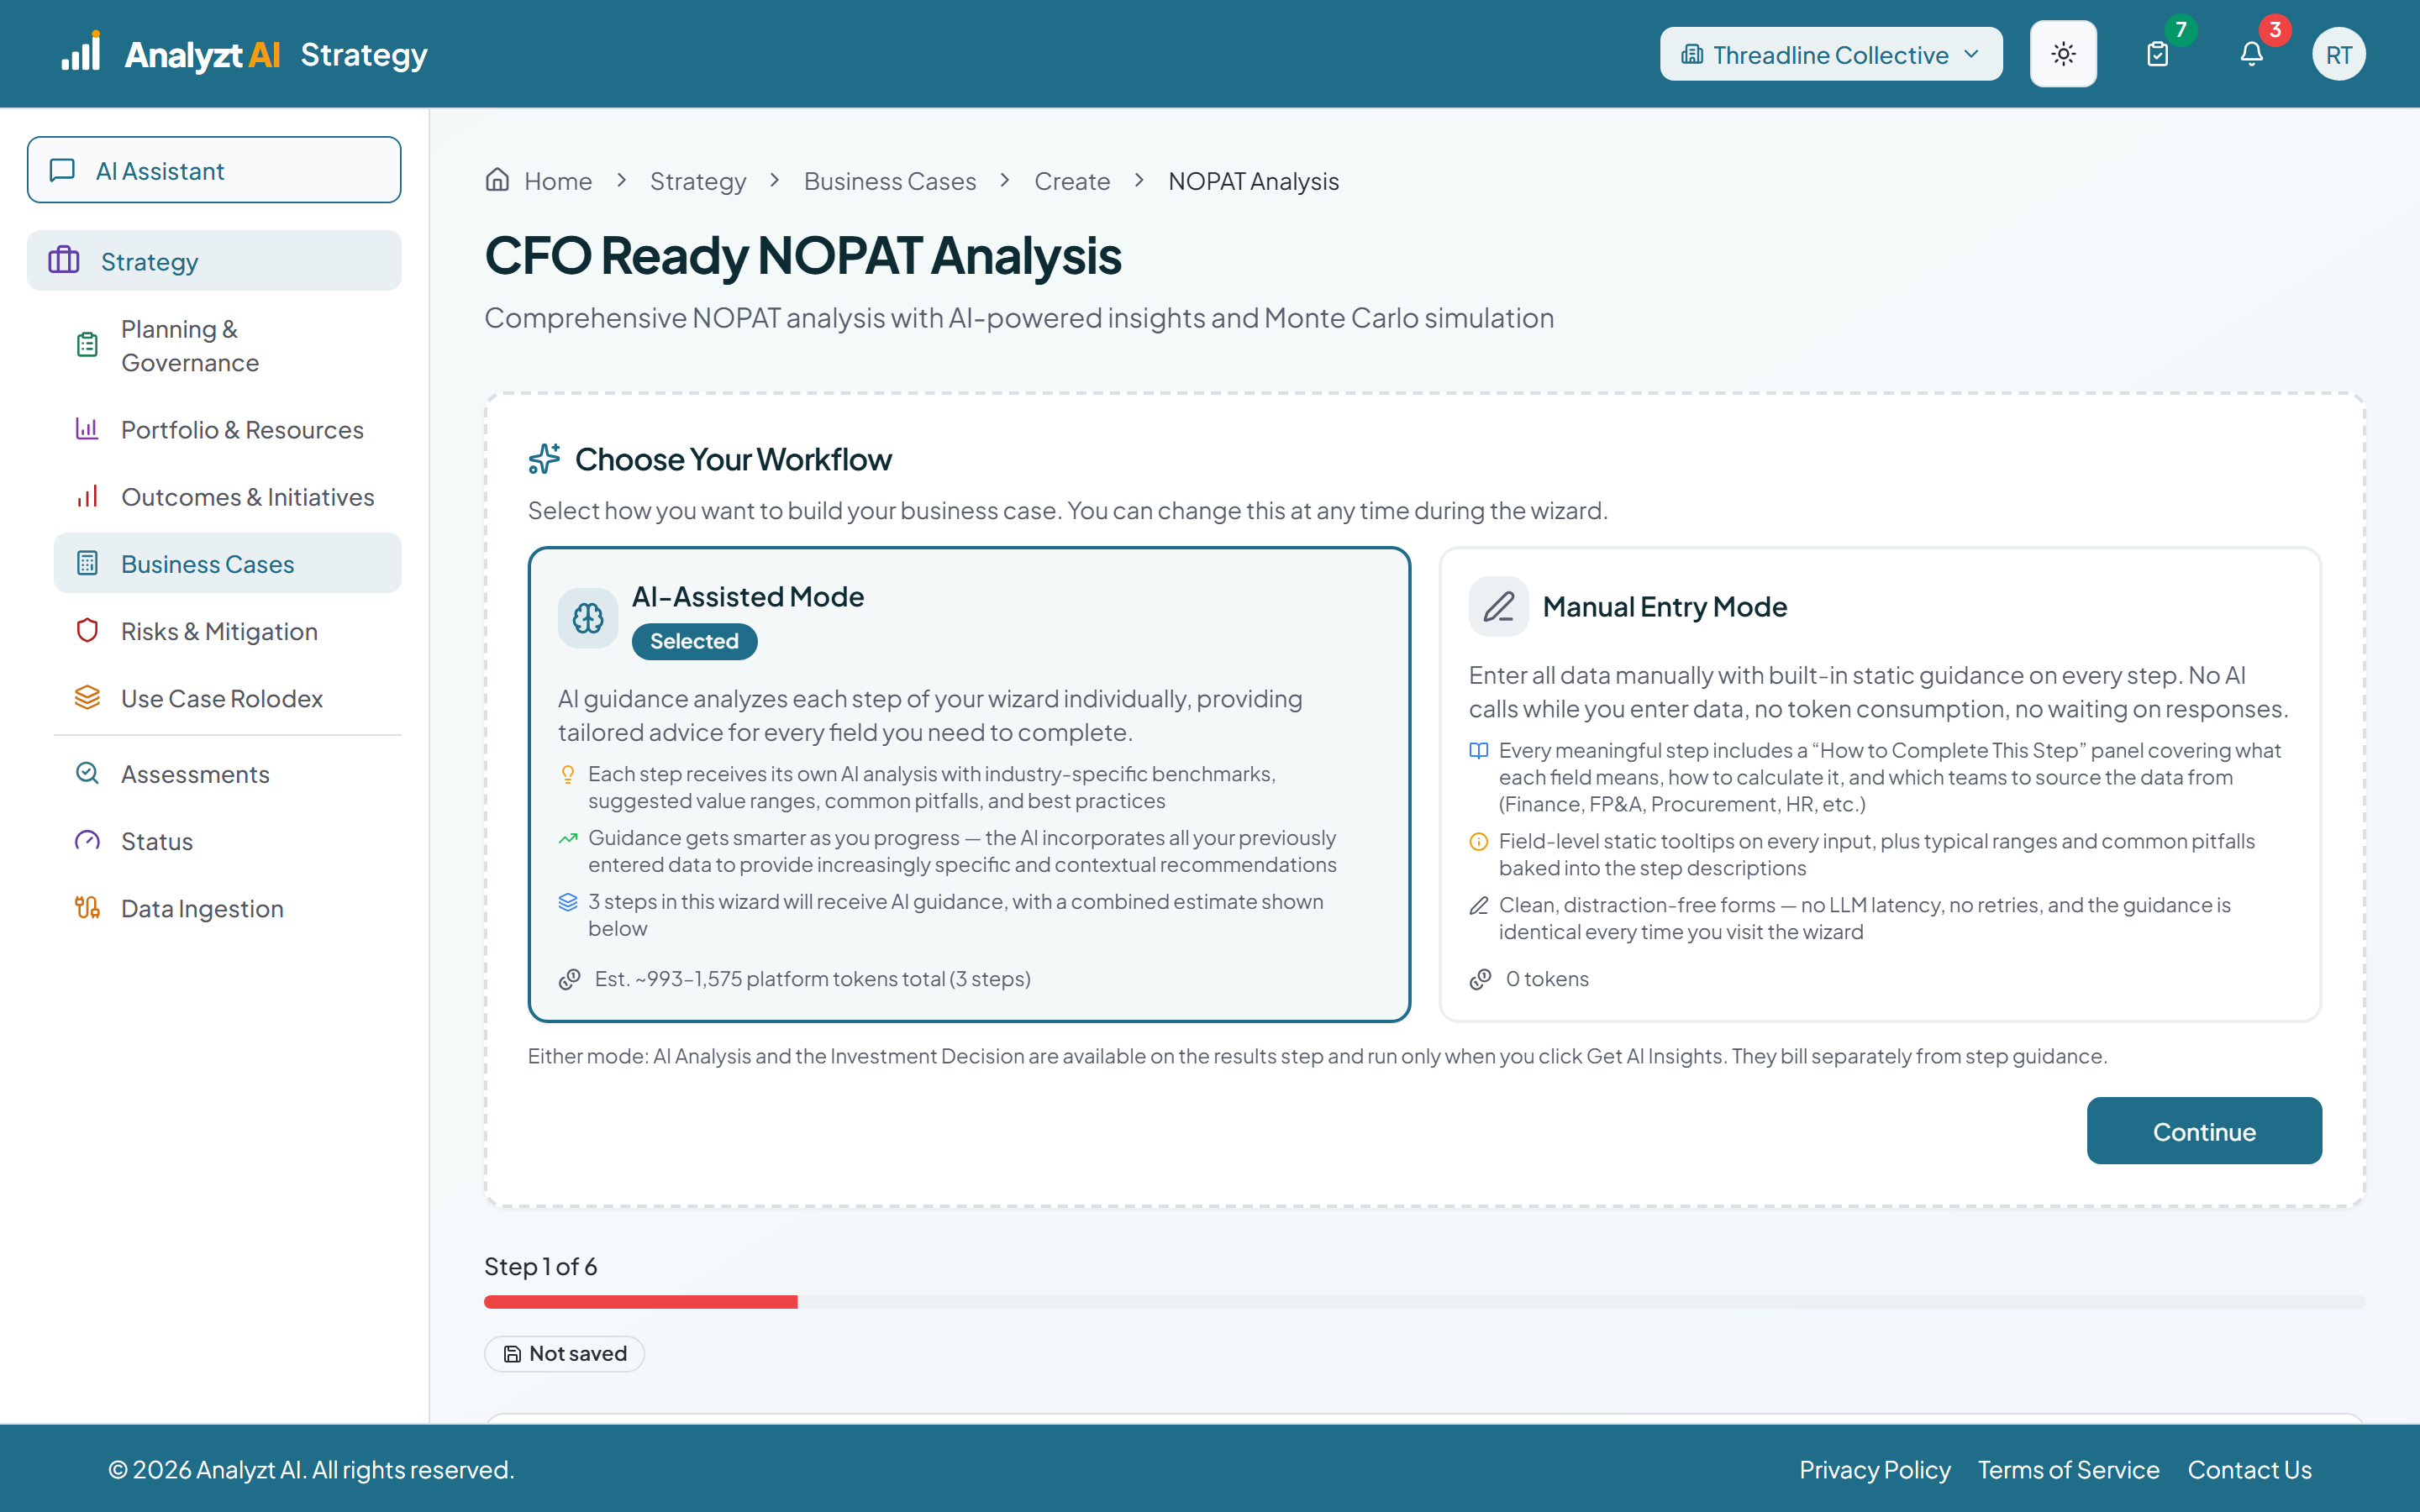 ~2 min
Finance · Executive
NOPAT, the CFO Model
Revenue and cost with the project and without it, tax, depreciation and WACC, then free cash flow assembled year by year. The CFO summary prices the incremental cash flows at WACC for NPV, solves IRR and MIRR and reports economic value added, so a project only earns a place when it returns more than its capital costs.
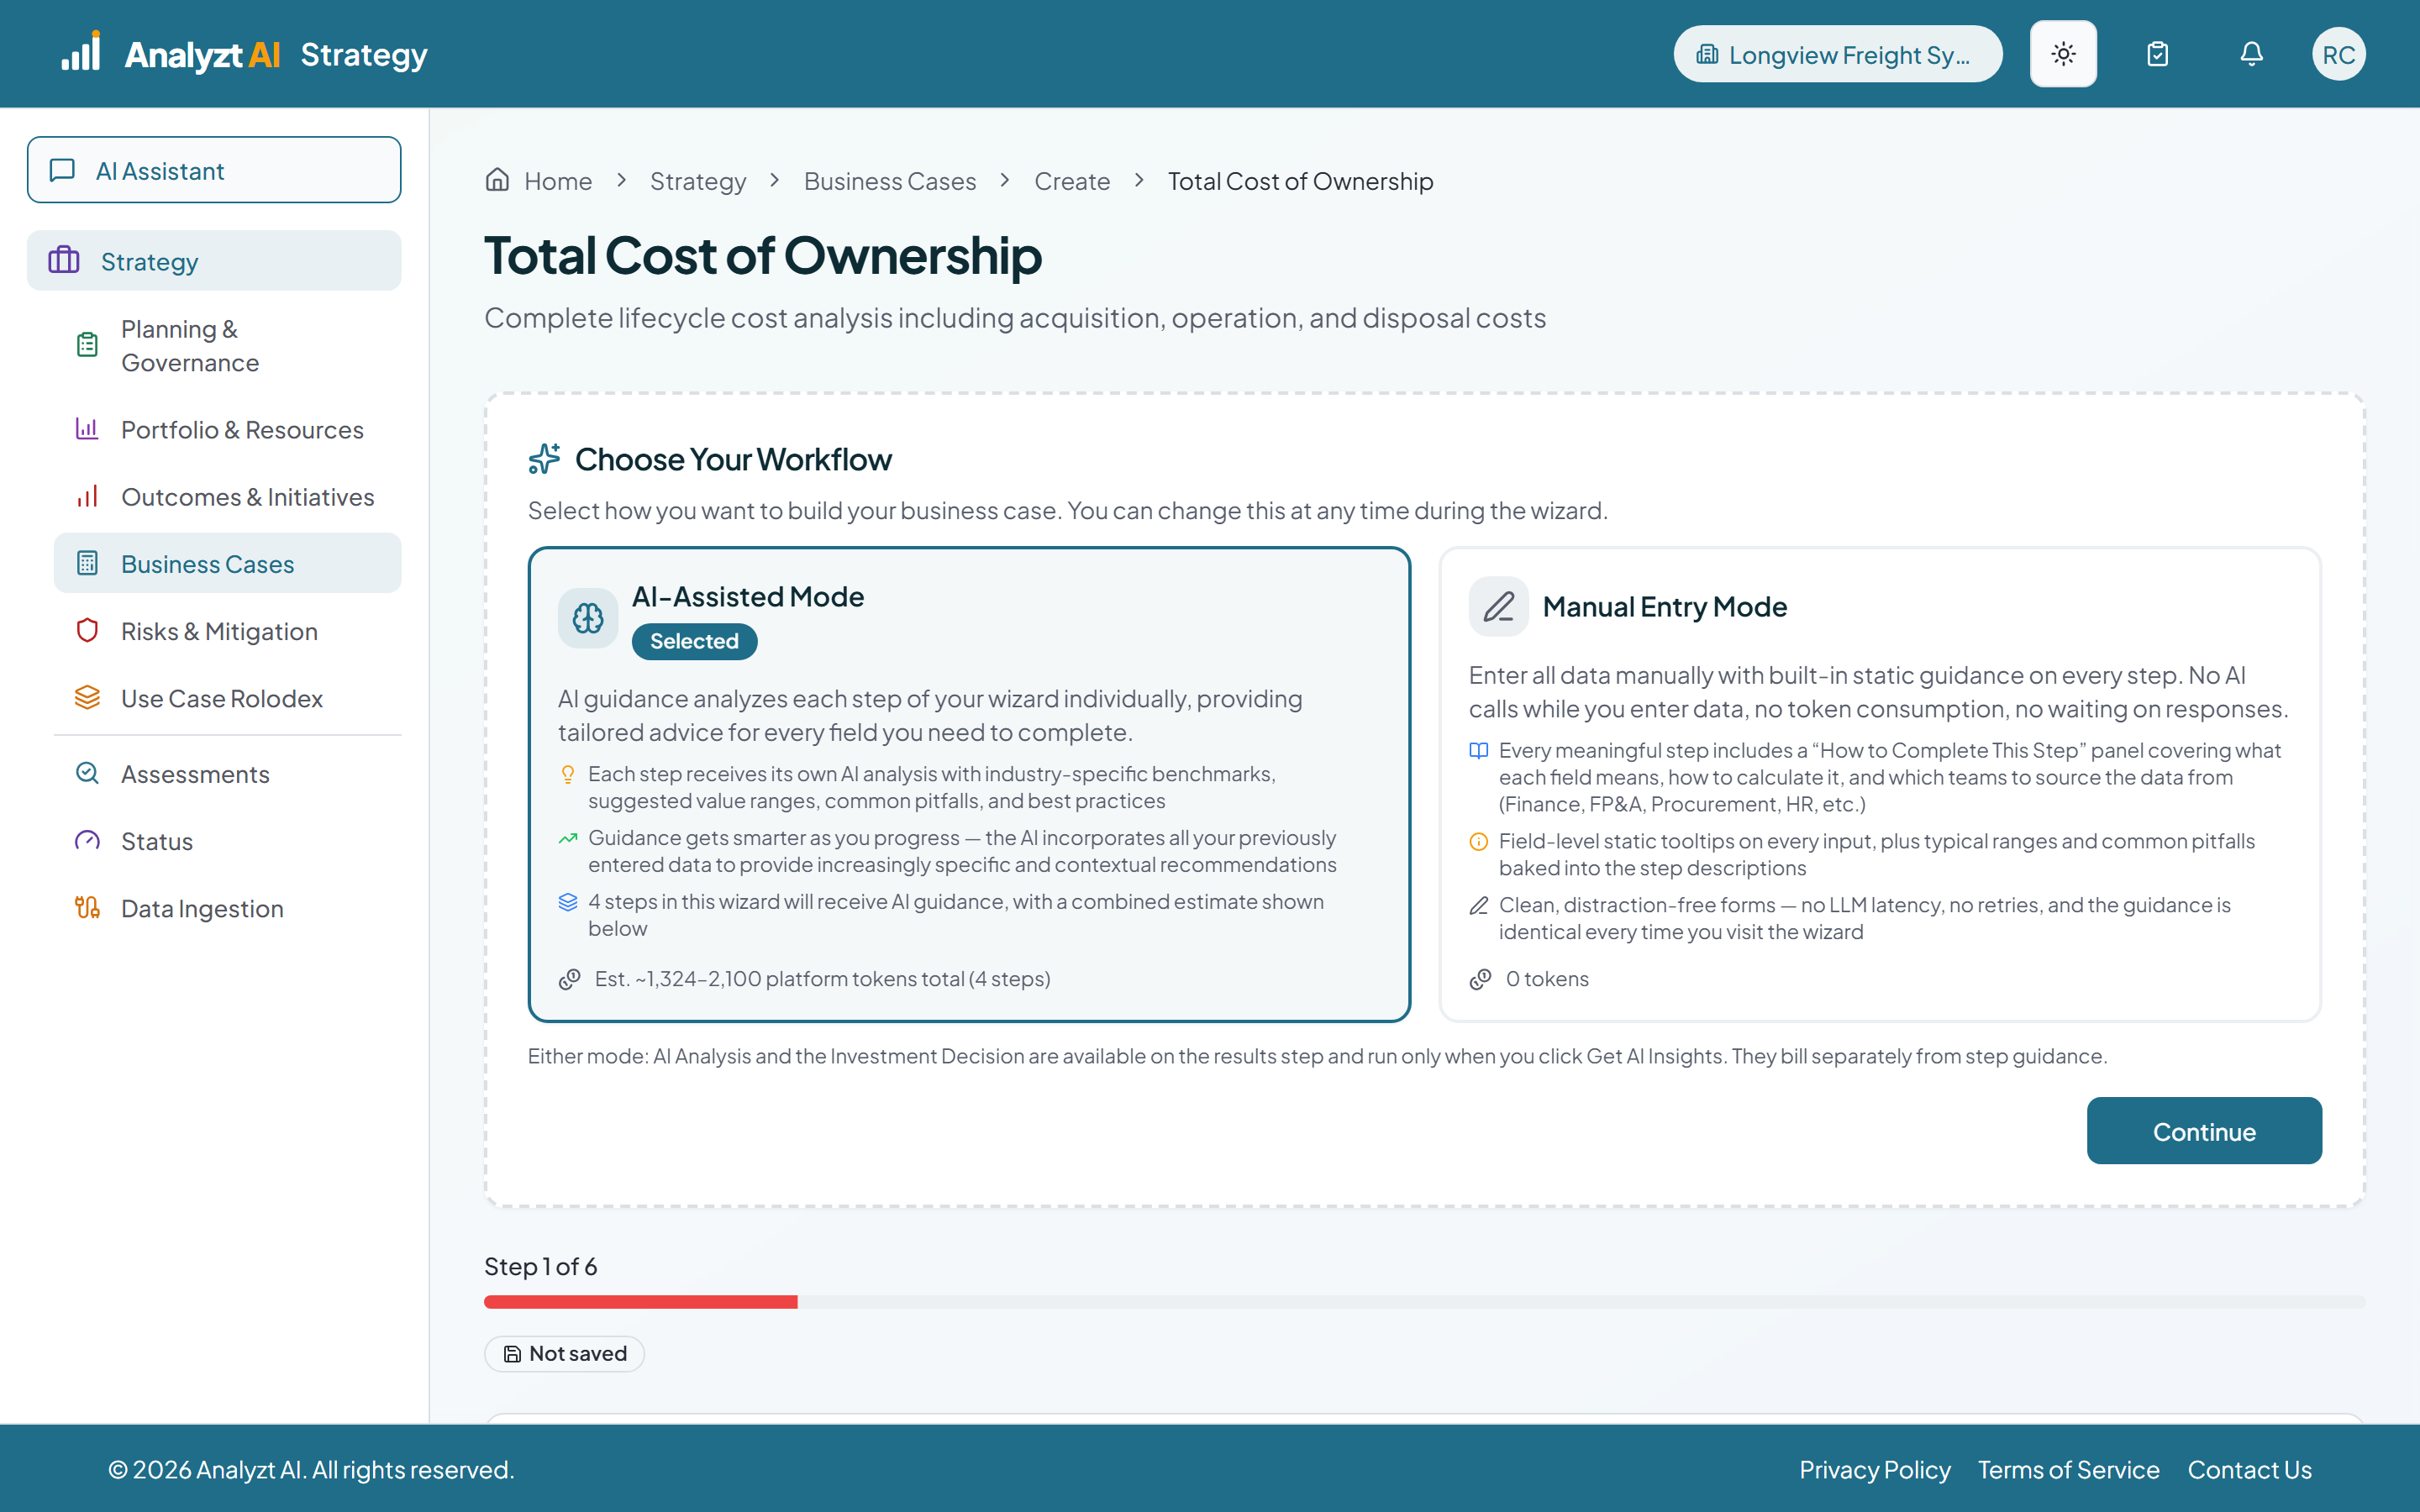 ~2 min
Finance · Strategy lead
Total Cost of Ownership, Line by Line
Acquisition, operating, maintenance and end of life costs as line items over the useful life, totaled into TCO, cost per year, the NPV of costs and the equivalent annual cost. A cost case is judged on cost, so the decision reads completeness and the Monte Carlo overrun against plan rather than an NPV above zero.
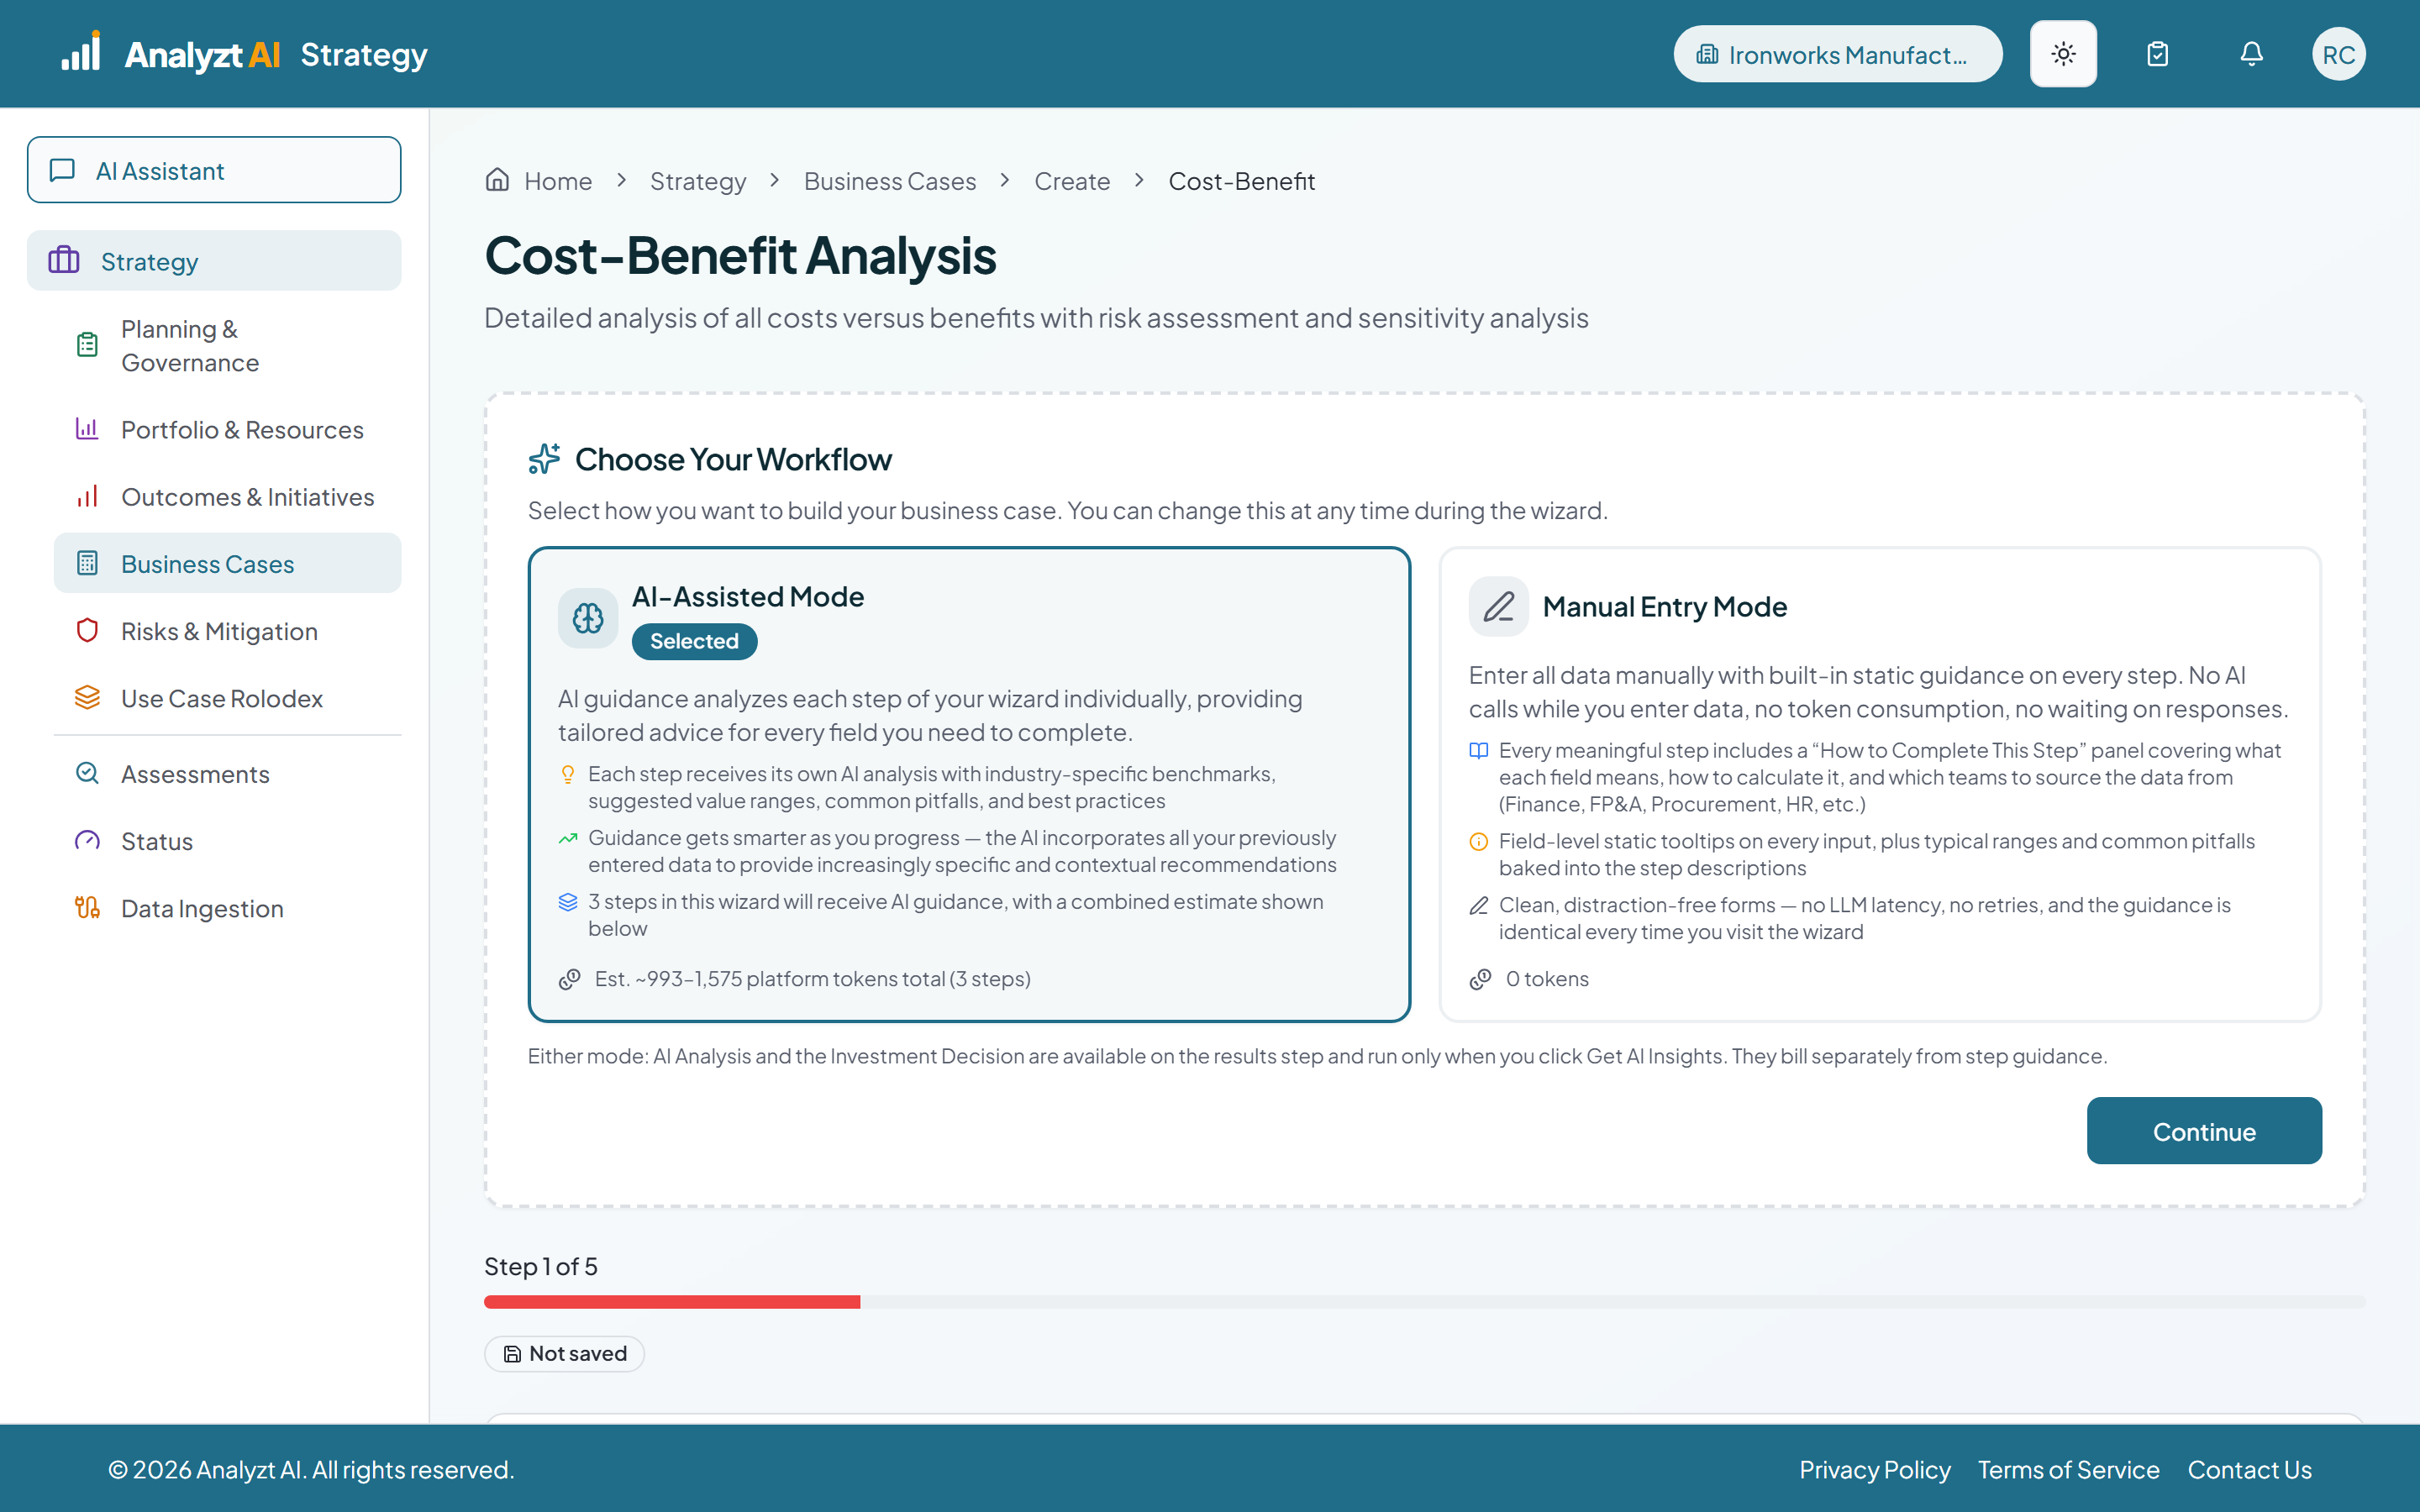 ~2 min
Finance · Strategy lead
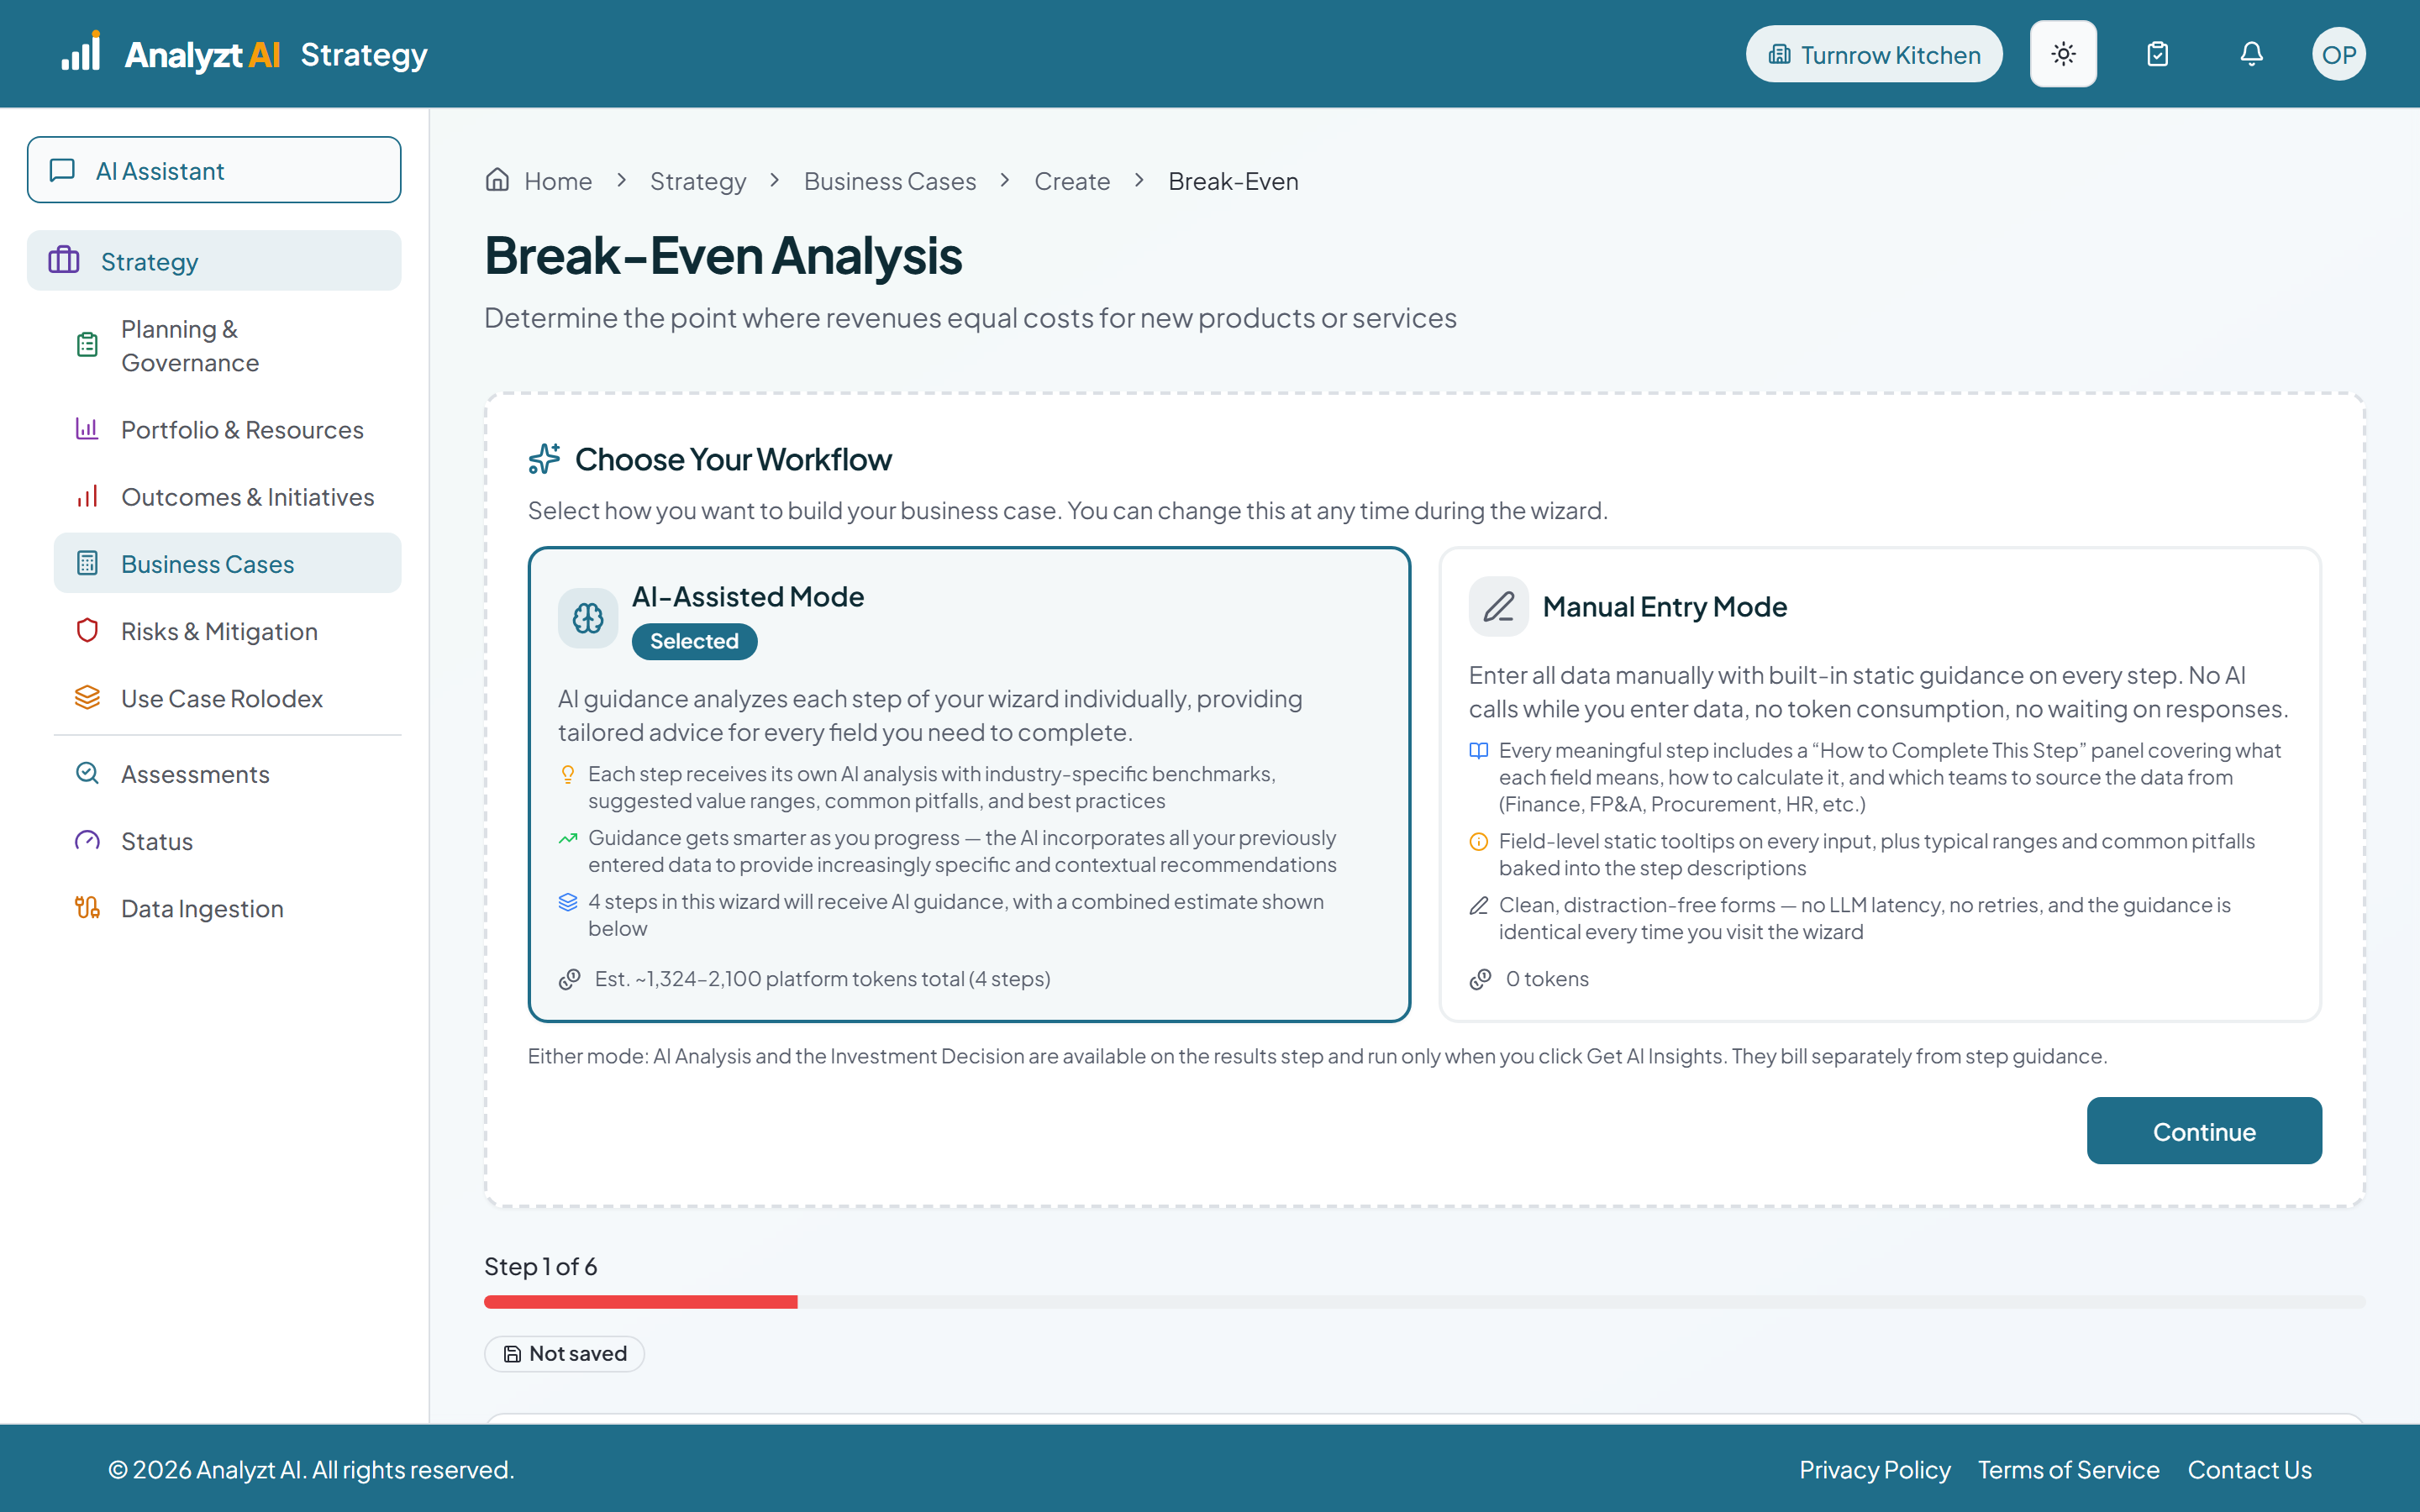
Cost Benefit, Discounted
One time and recurring costs kept apart, quantified benefits by source, then NPV, the benefit cost ratio, IRR and discounted payback from the two ledgers. The decision applies the stated gates and returns a conditional verdict when the risk read says so, with the conditions listed.
 ~2 min
Finance · Strategy lead
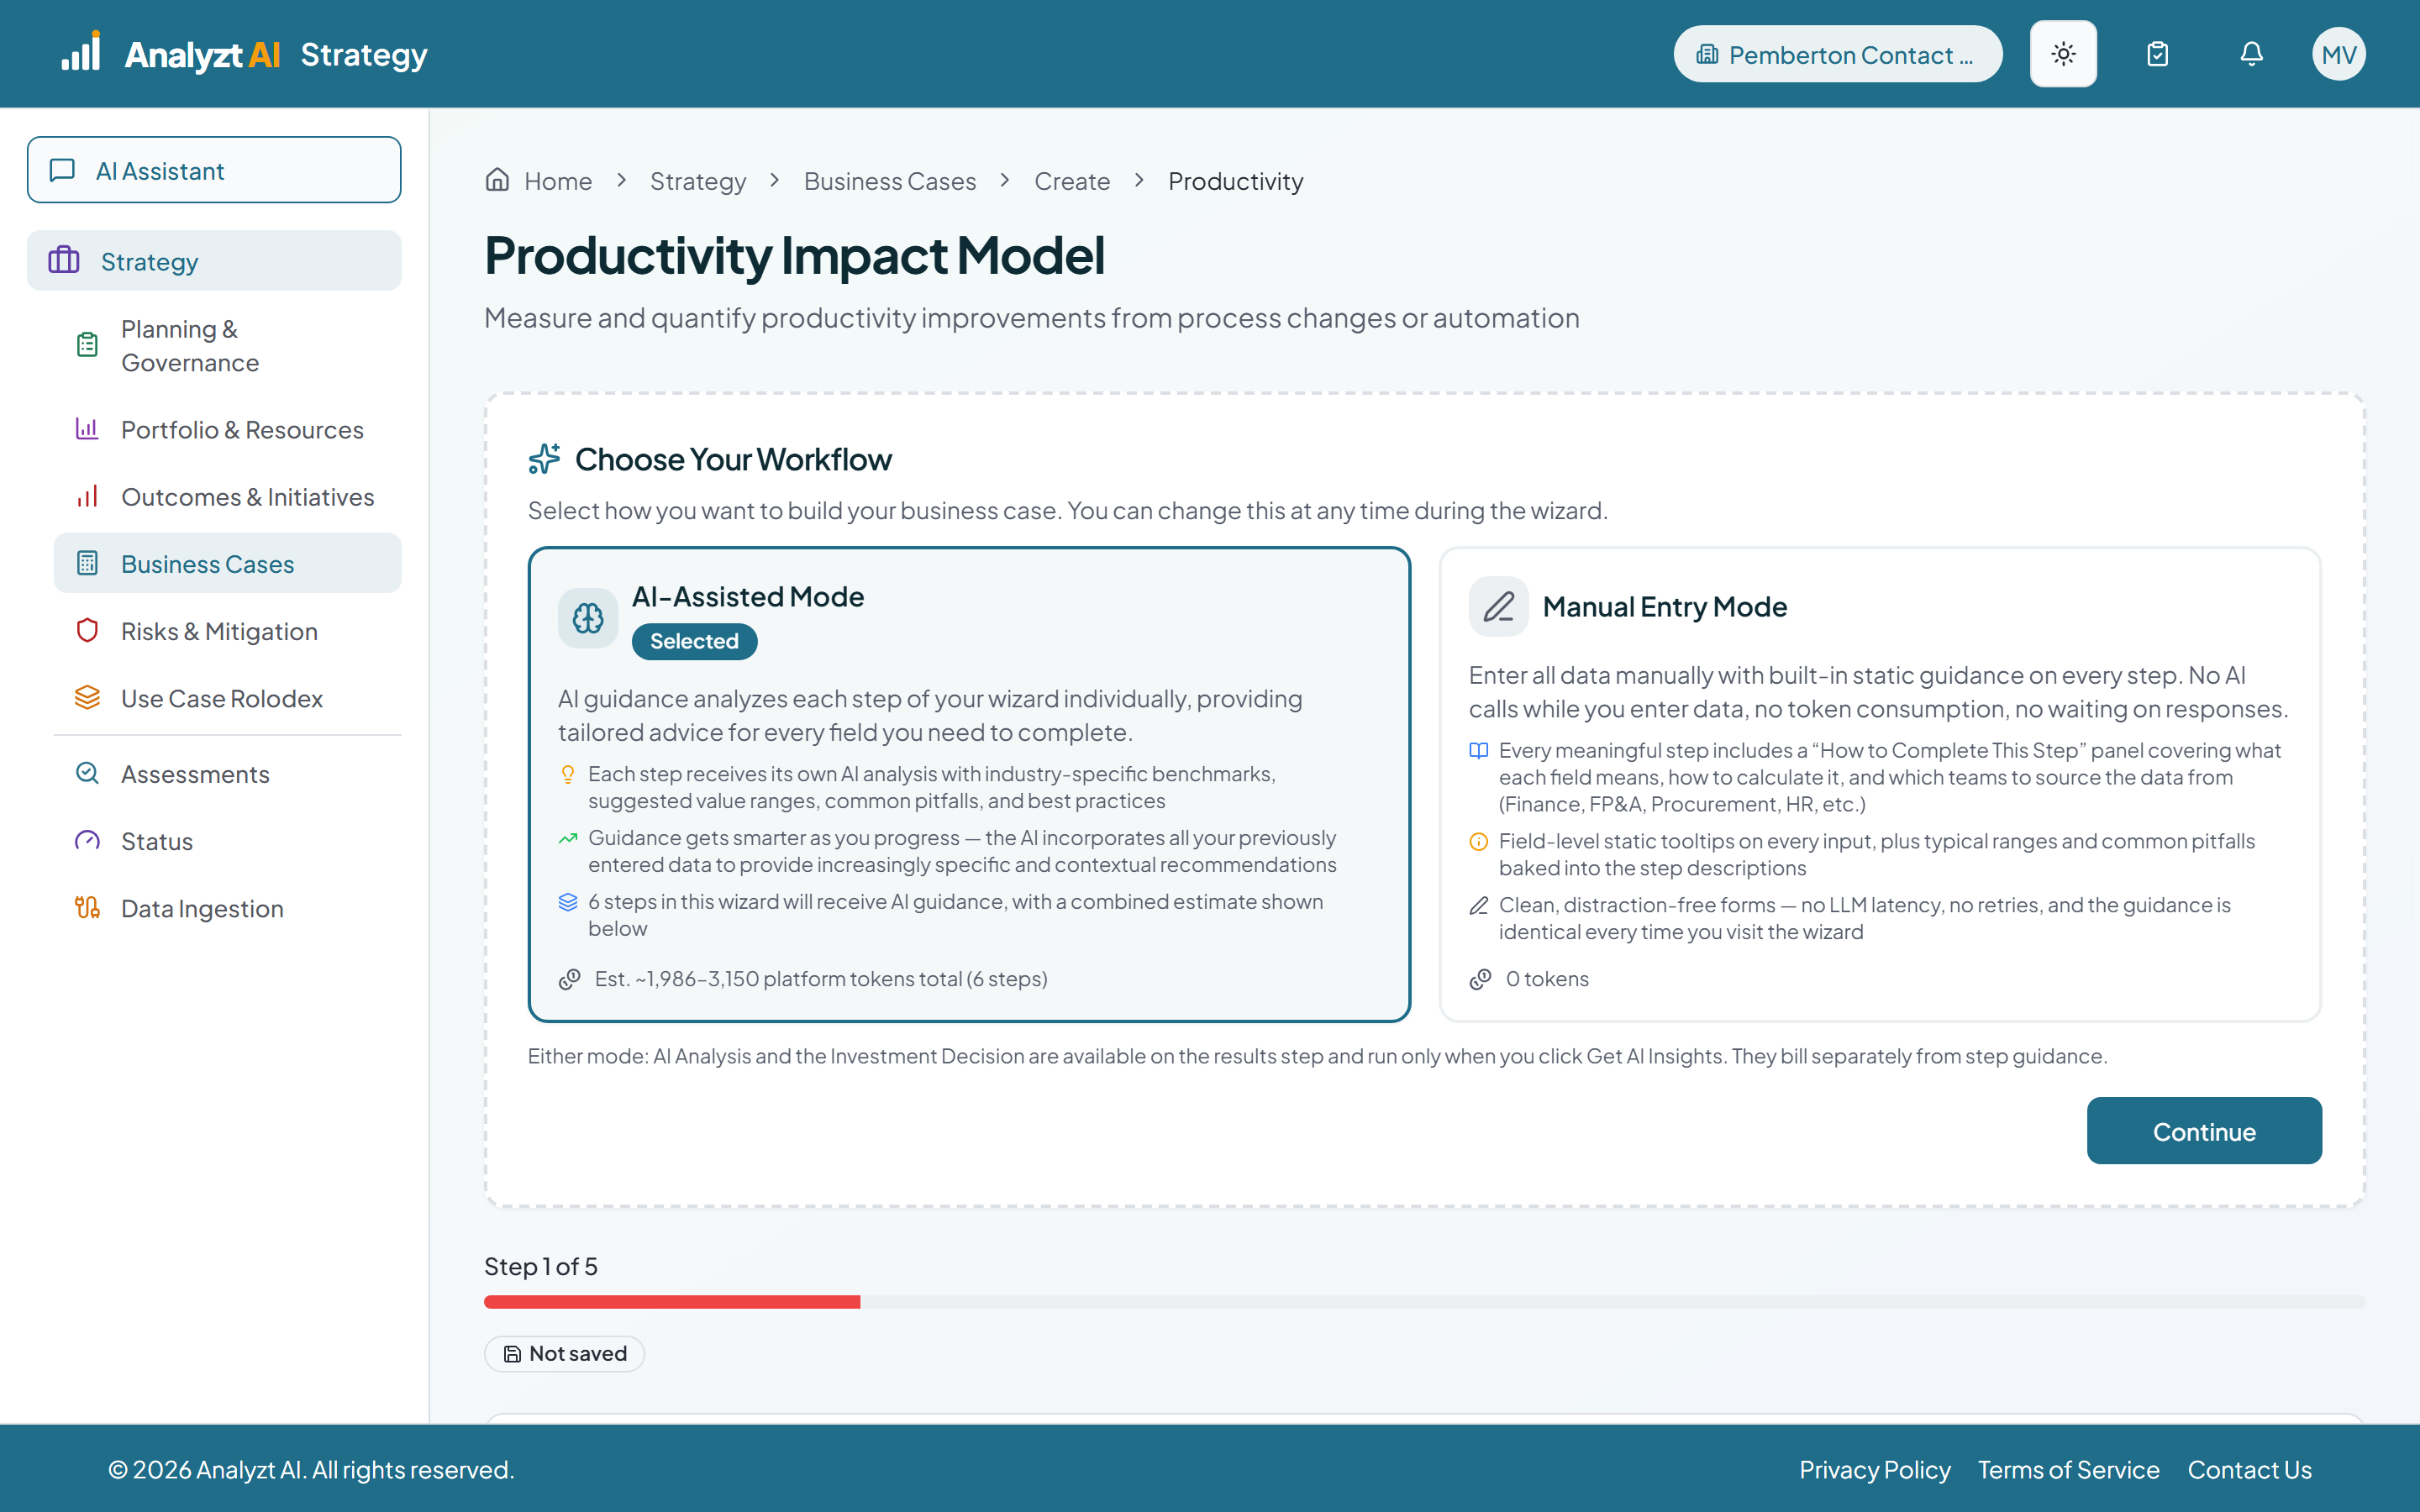
Break Even, Unit by Unit
Fixed costs by the month, variable costs per unit, price and expected volume, then break even units and revenue, contribution margin, margin of safety and months to break even. The gates are the margin of safety, the time to break even and the Monte Carlo probability of loss.
 ~2 min
Finance · Strategy lead
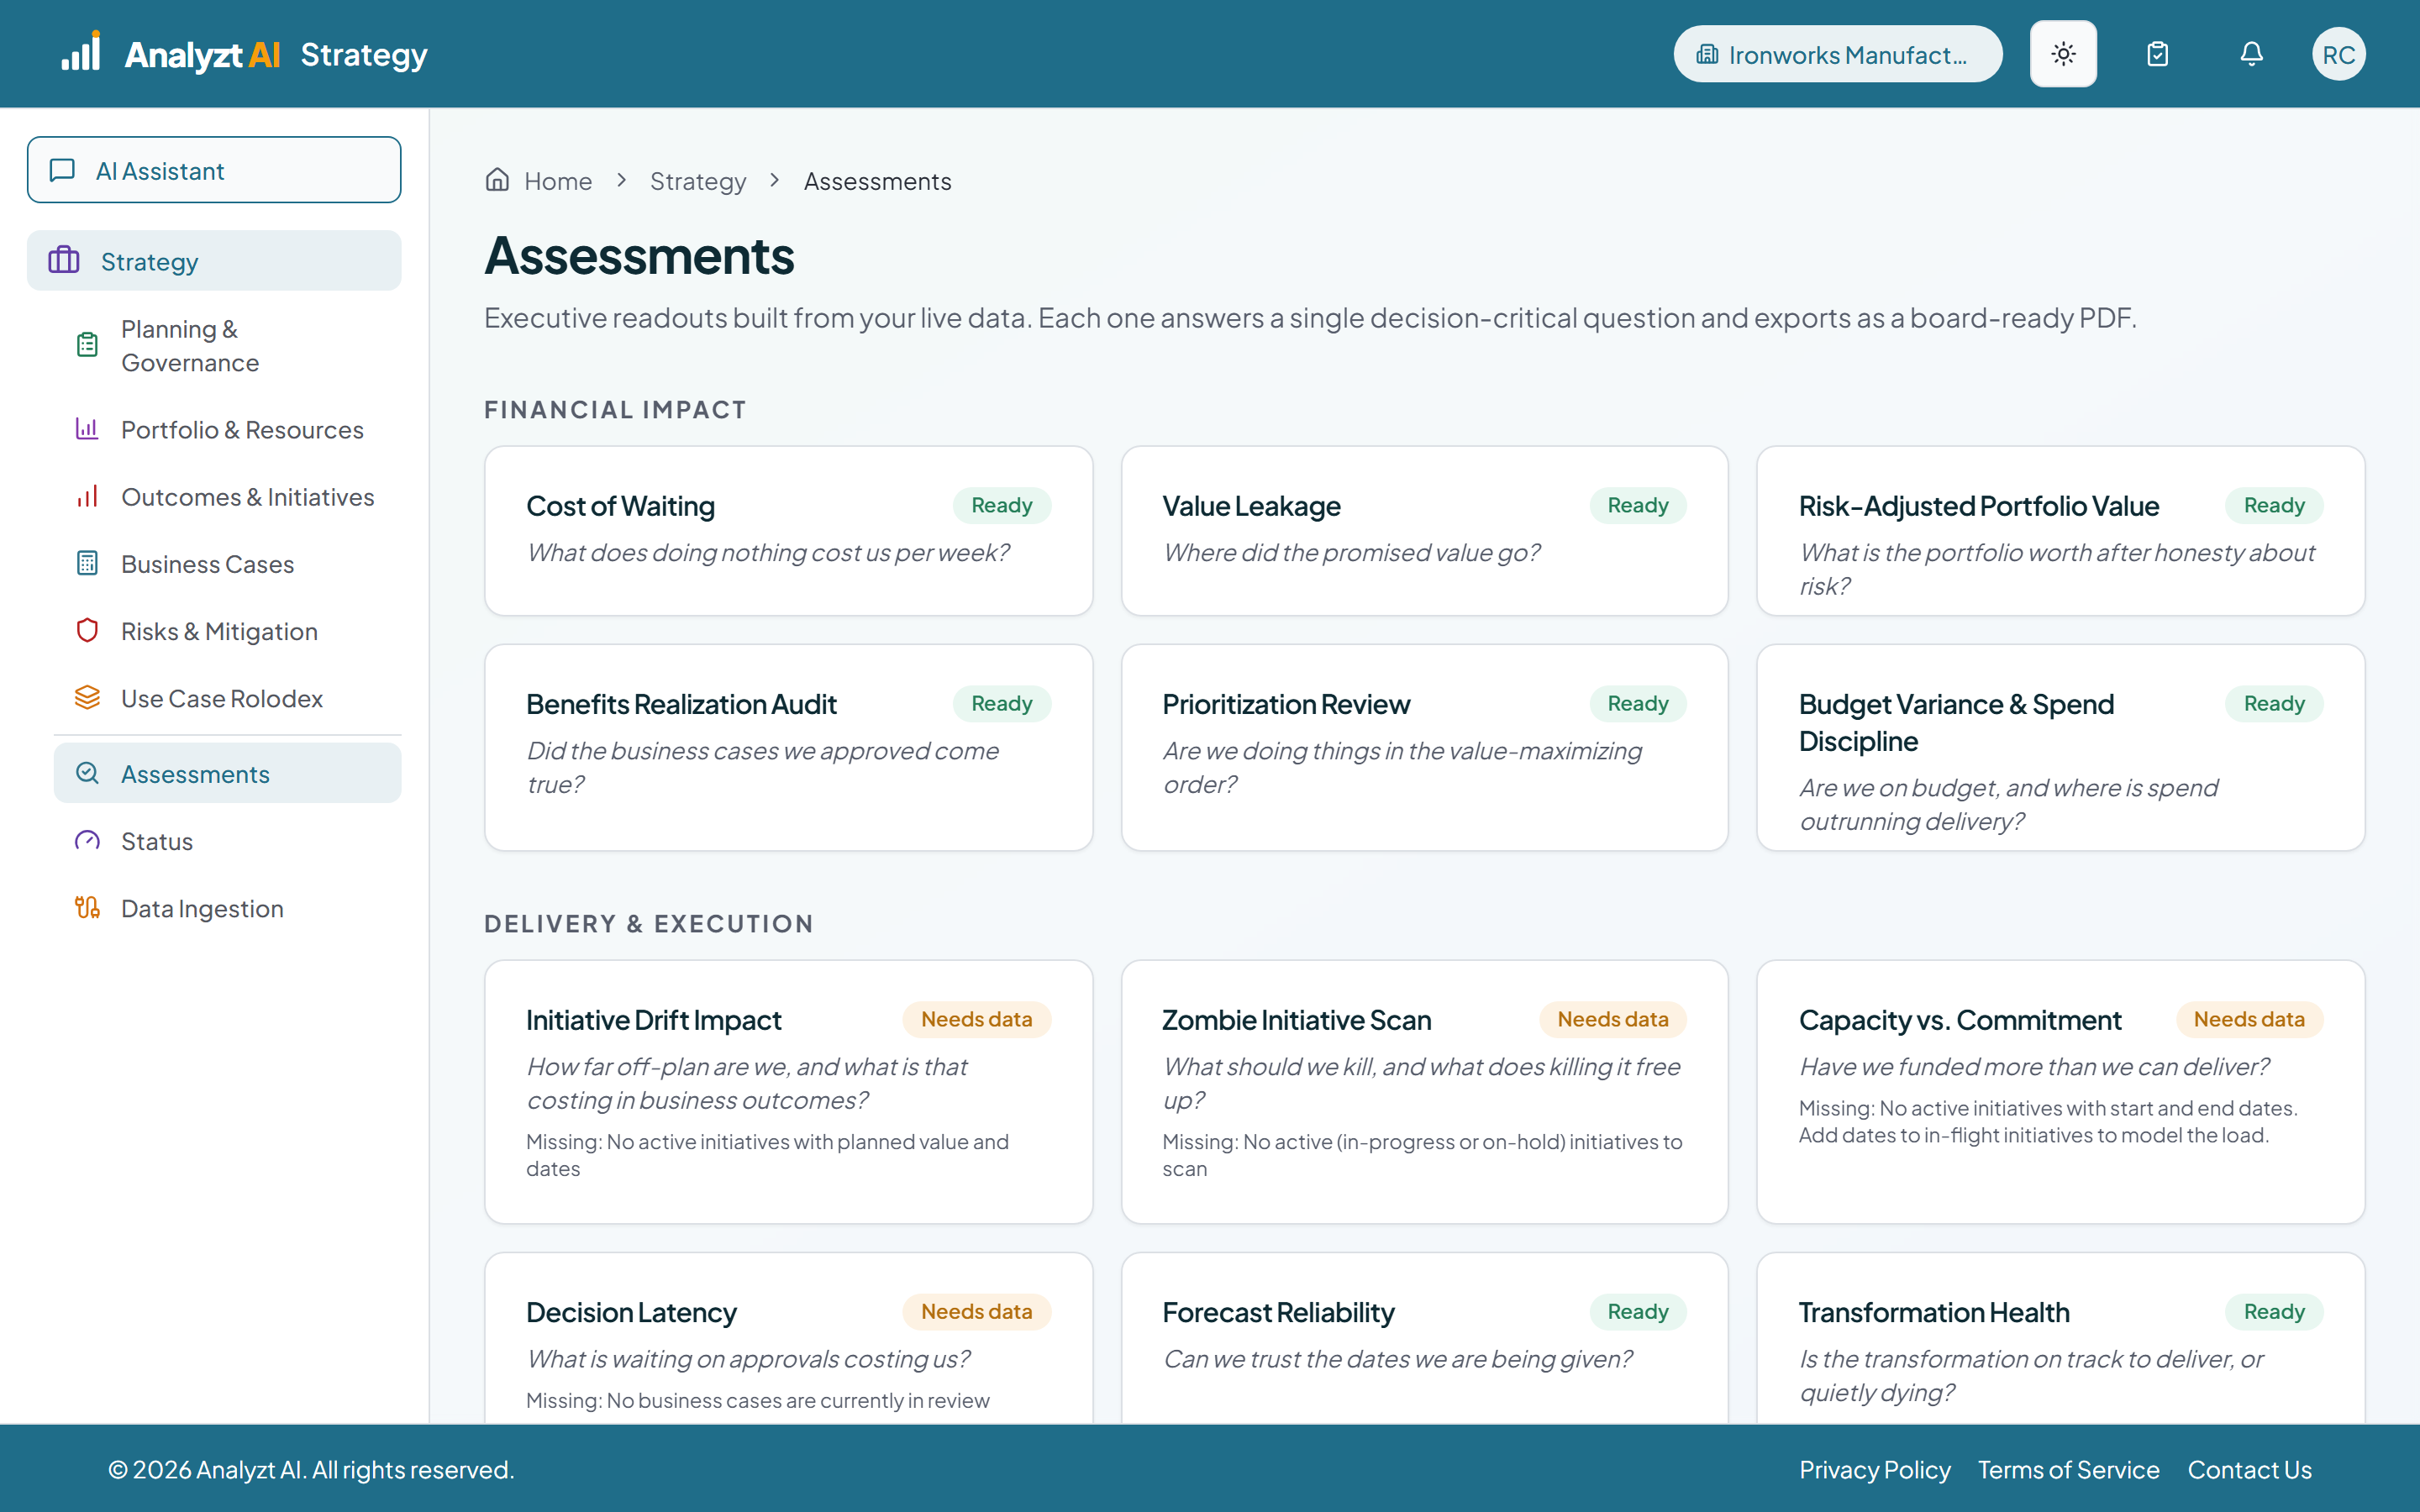
Productivity, Priced
Current and future state on cycle time, throughput, quality and monthly cost, then volume adjusted savings, ROI, payback and NPV against the implementation budget, with the arithmetic shown. The models and the decision follow on the executive summary step.
 ~1 min
Executive
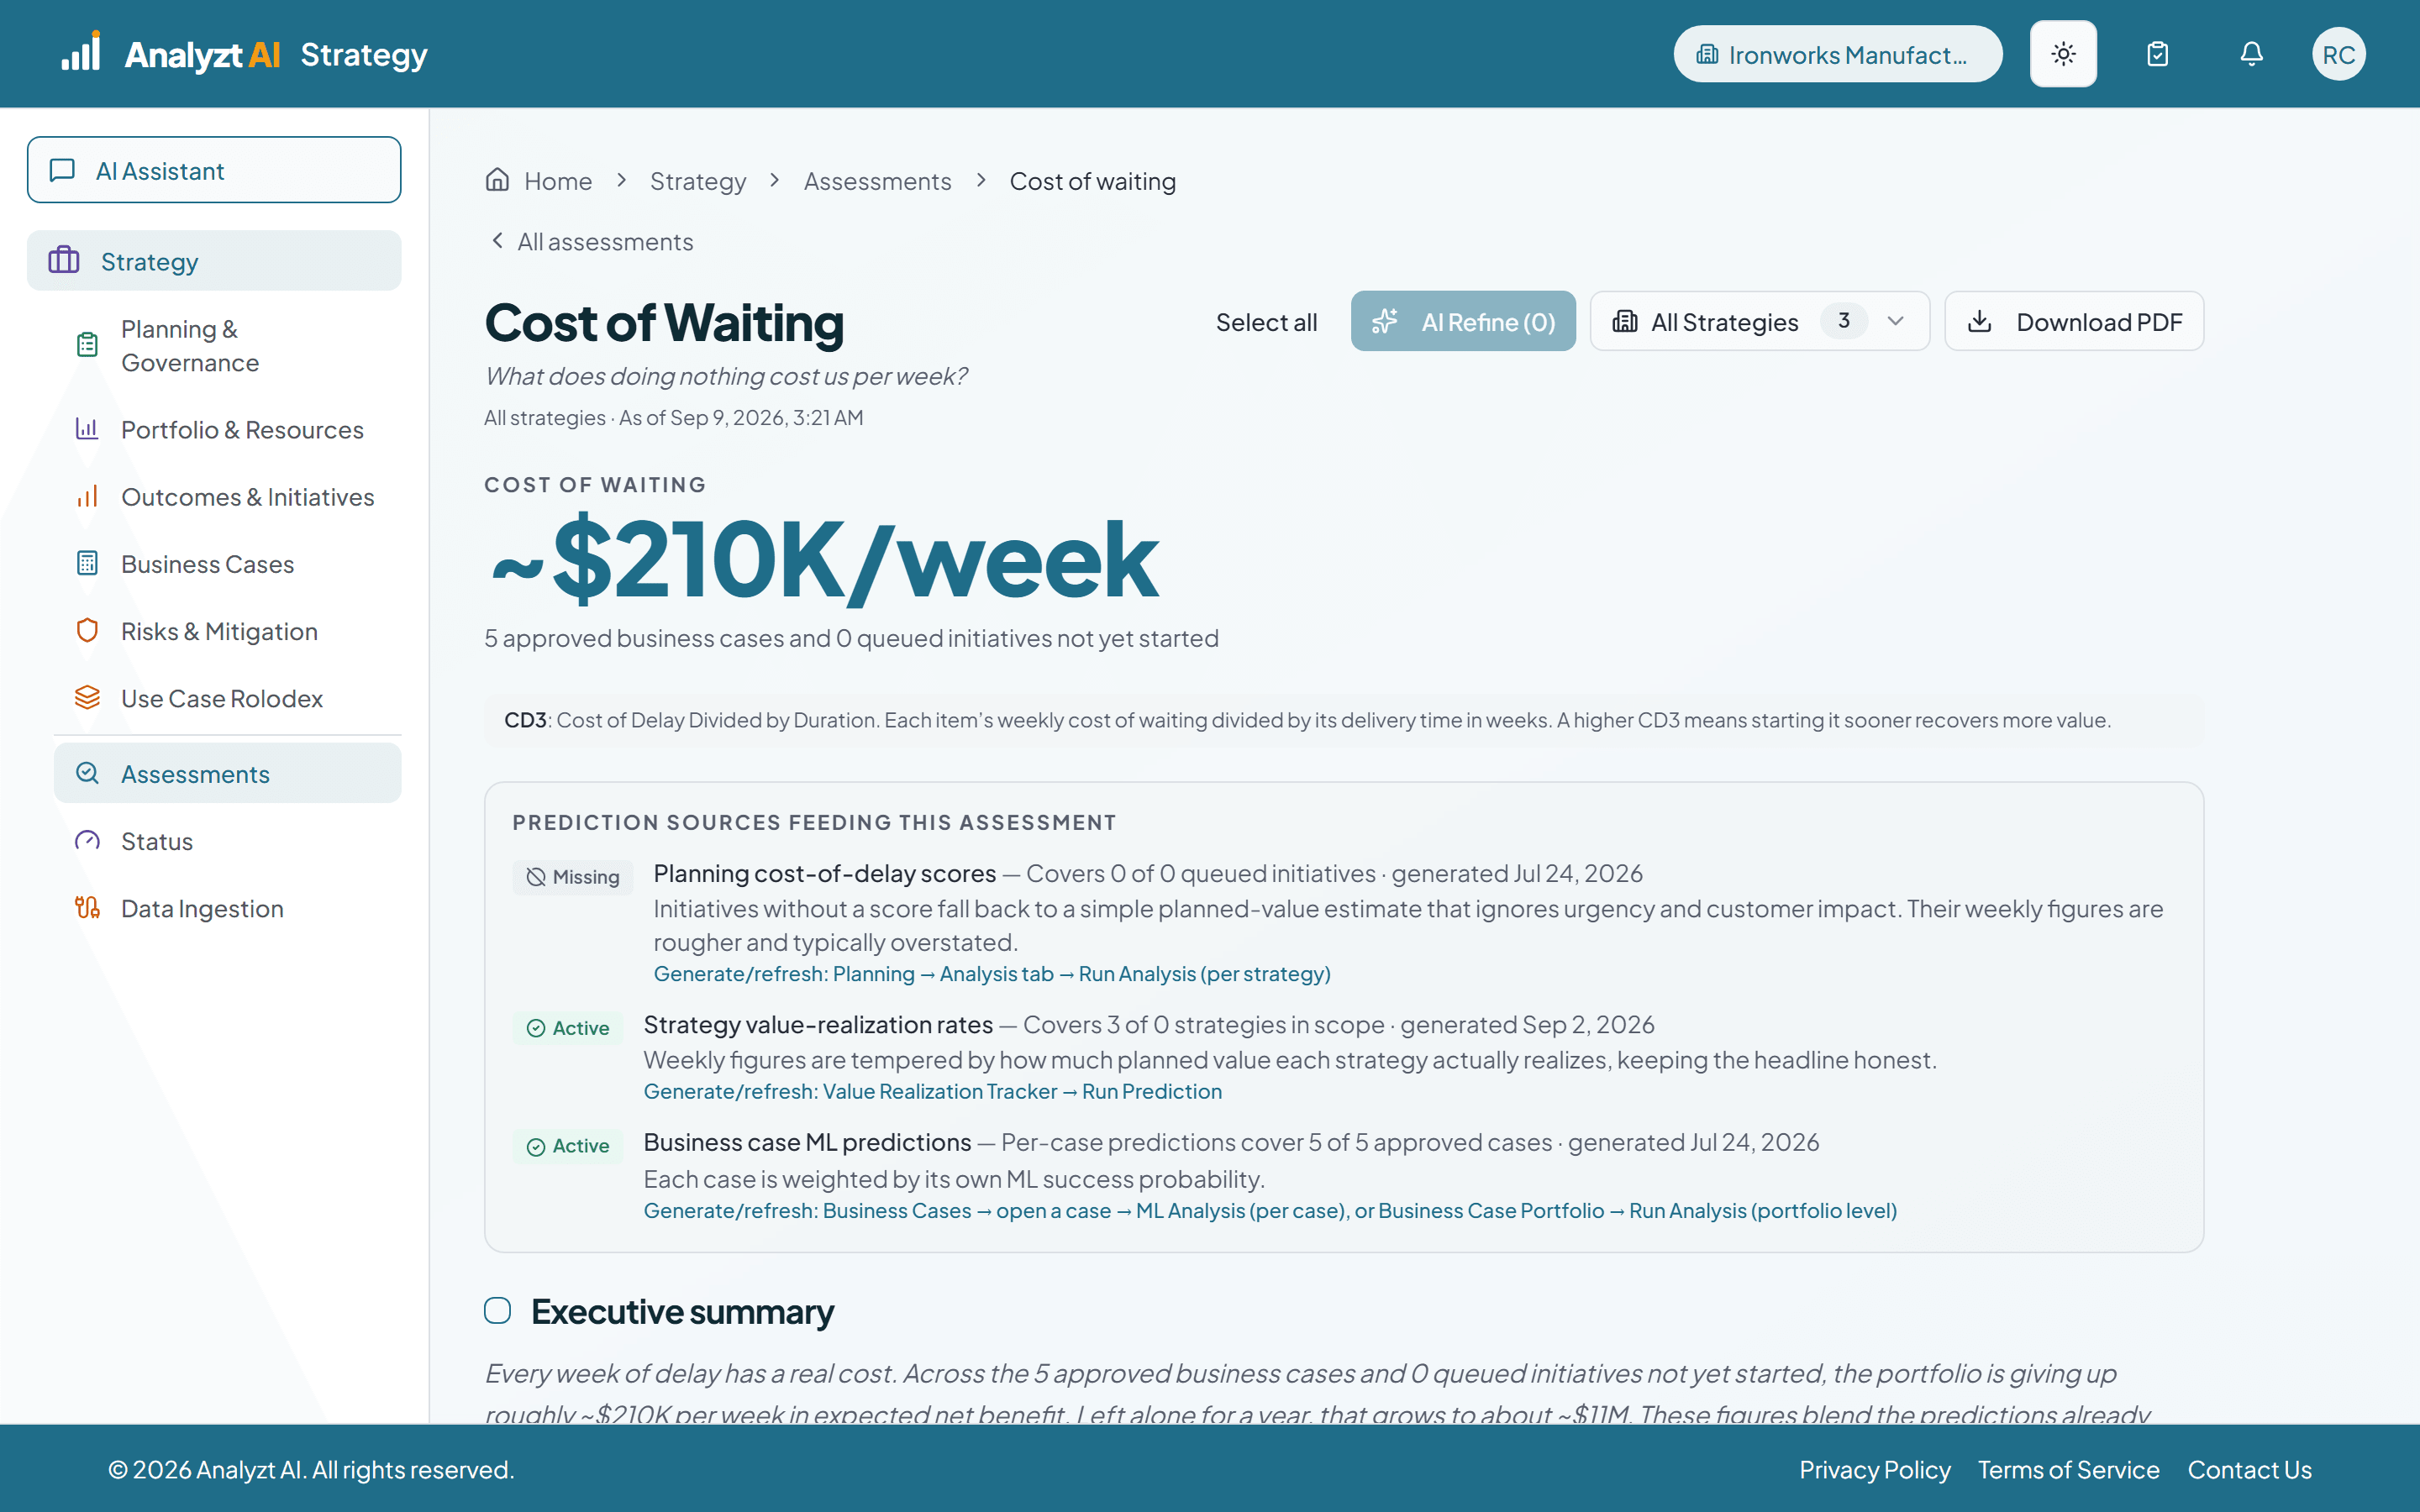
The Assessment Library
Twenty four executive readouts built from the data already in the platform. Every one is phrased as a question, and where it cannot answer it says so and names exactly what is missing.
 ~1 min
Executive · Finance
A Board Ready Readout
One question, answered in a number, with the method named and every prediction that fed it listed. It ends on decisions required, which is what separates a readout from a dashboard.
Prediction
Prediction scores the plan and forecasts what the models expect. Outcomes, initiatives and milestones are scored separately, each with the inputs that drove the score and a stated confidence that falls as the horizon lengthens. Risks are scored, categorized and trended. Monte Carlo returns a range rather than a single figure.
9 demos
about 13 min
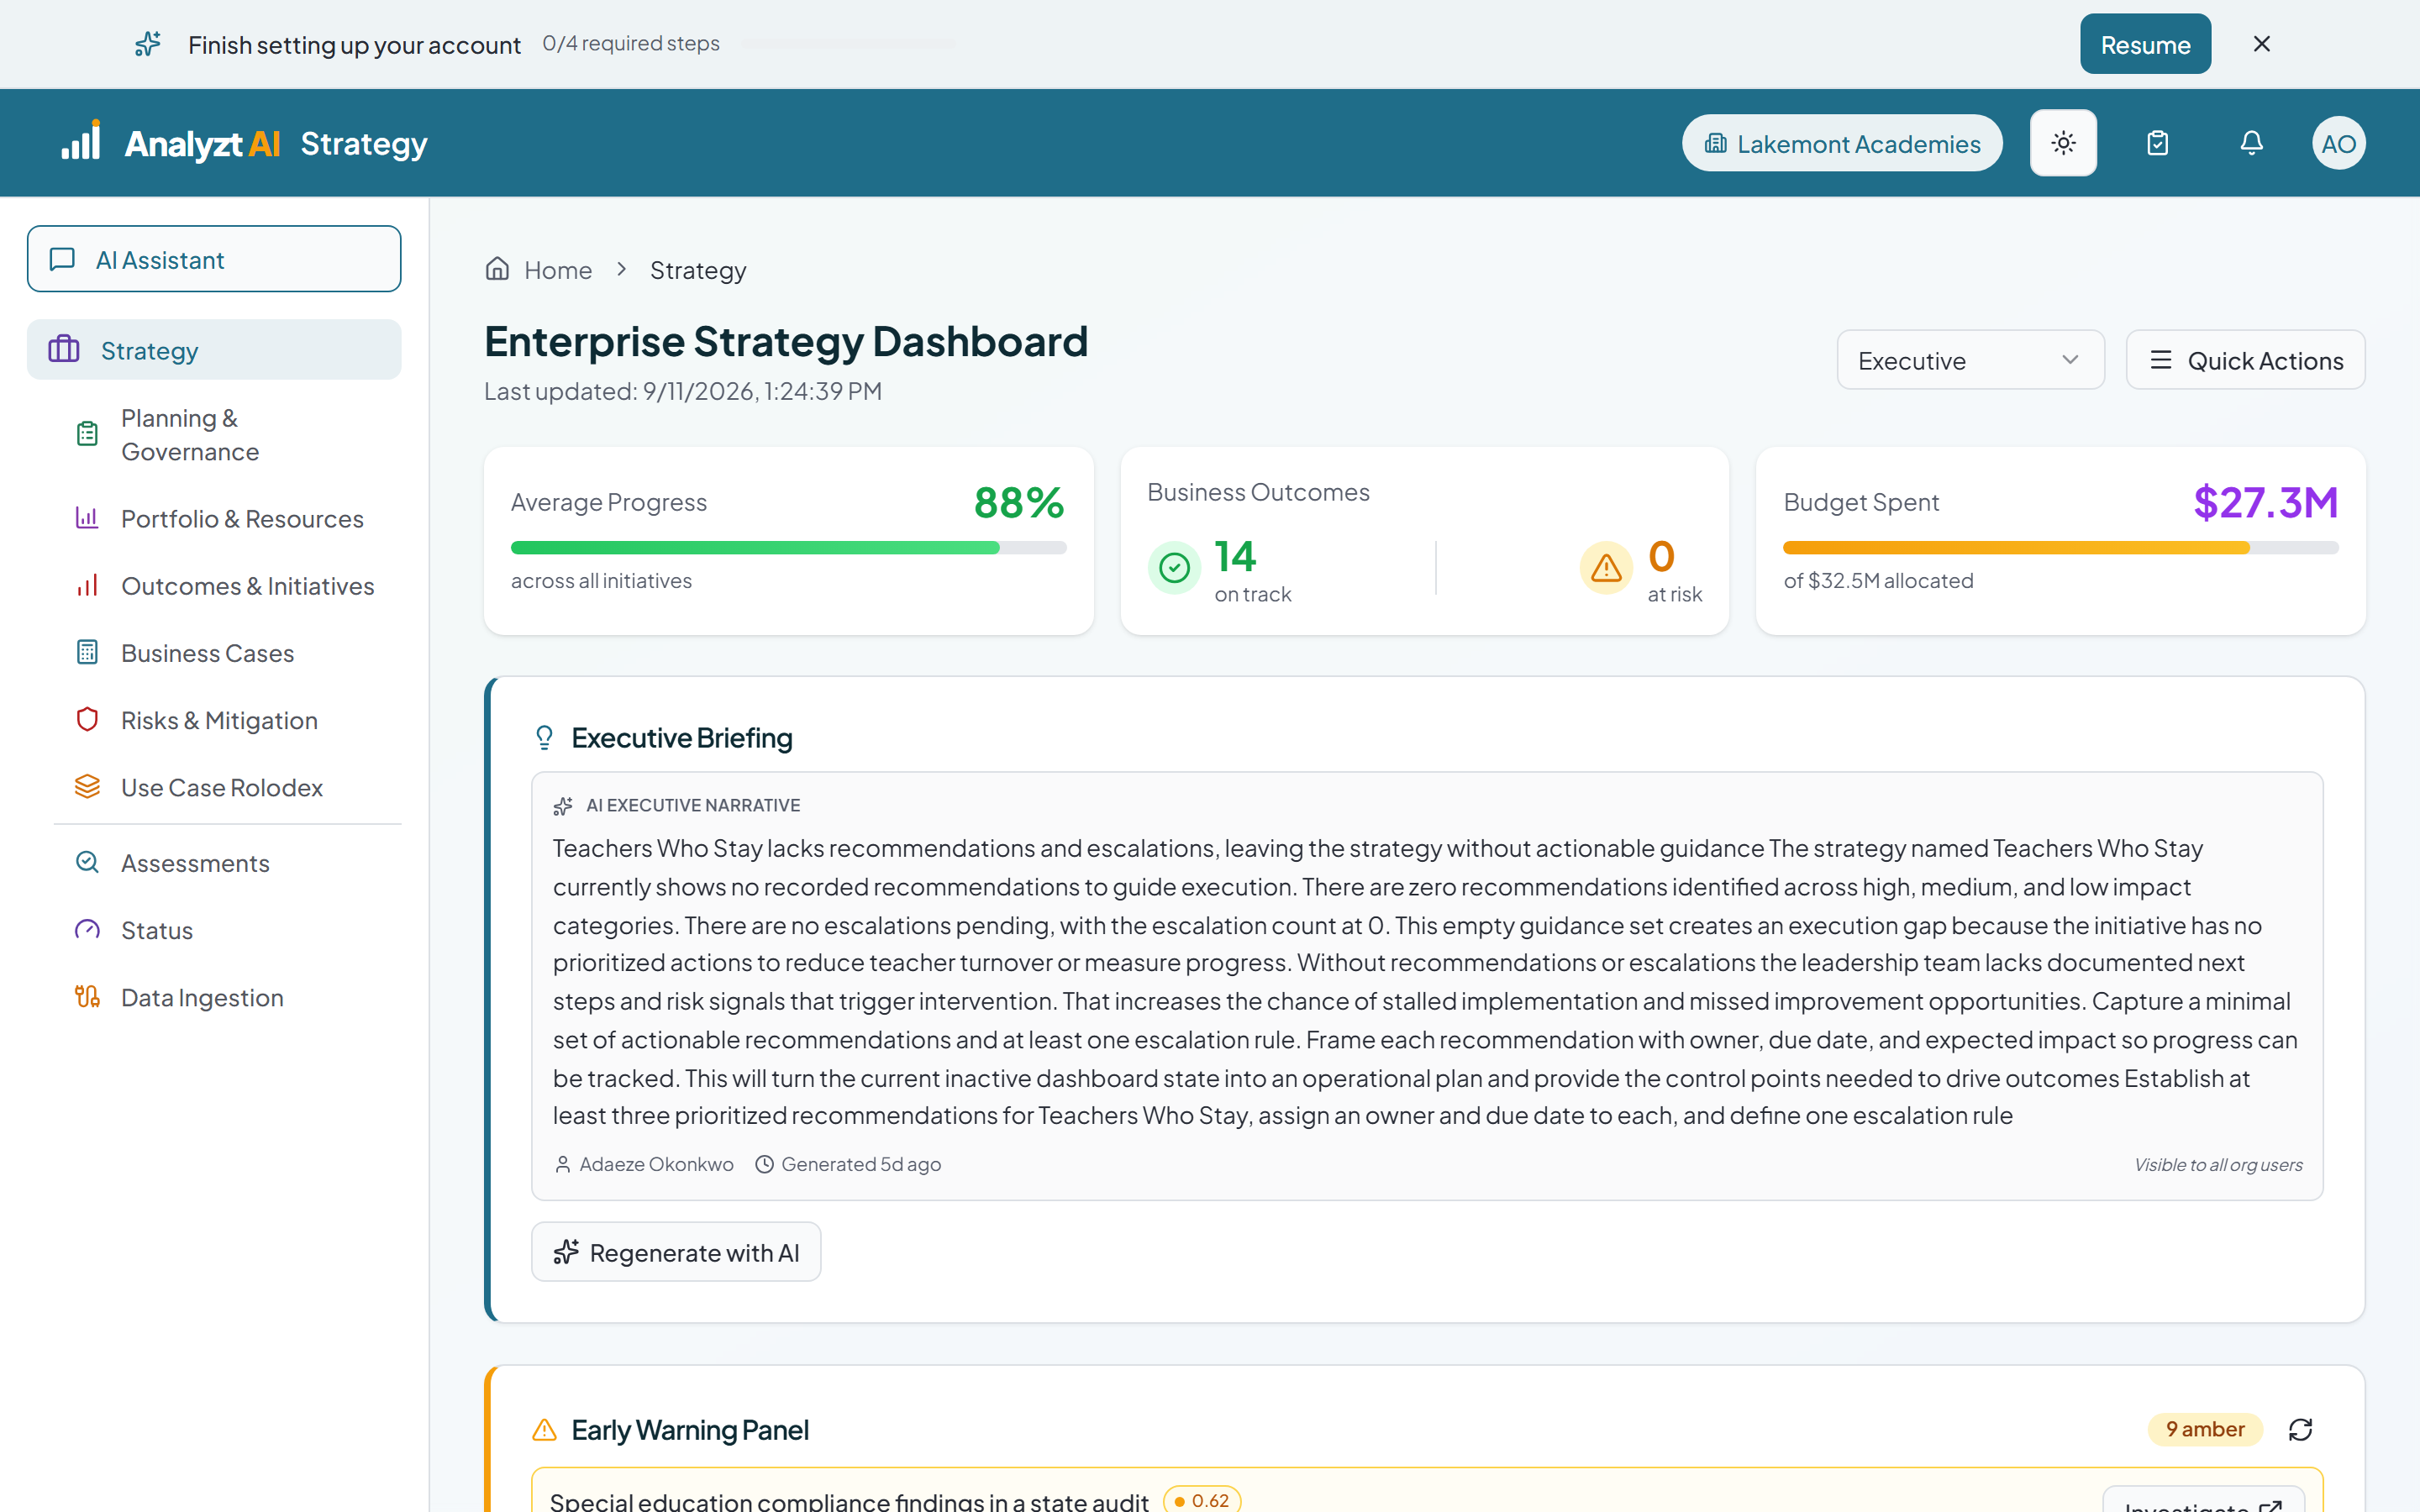 ~1 min
Strategy lead · Executive
How the Scores Are Made
Some numbers on the dashboard are calculated from your data and are exact. Others are model predictions and carry a confidence. This shows which is which, and how to tell them apart on screen.
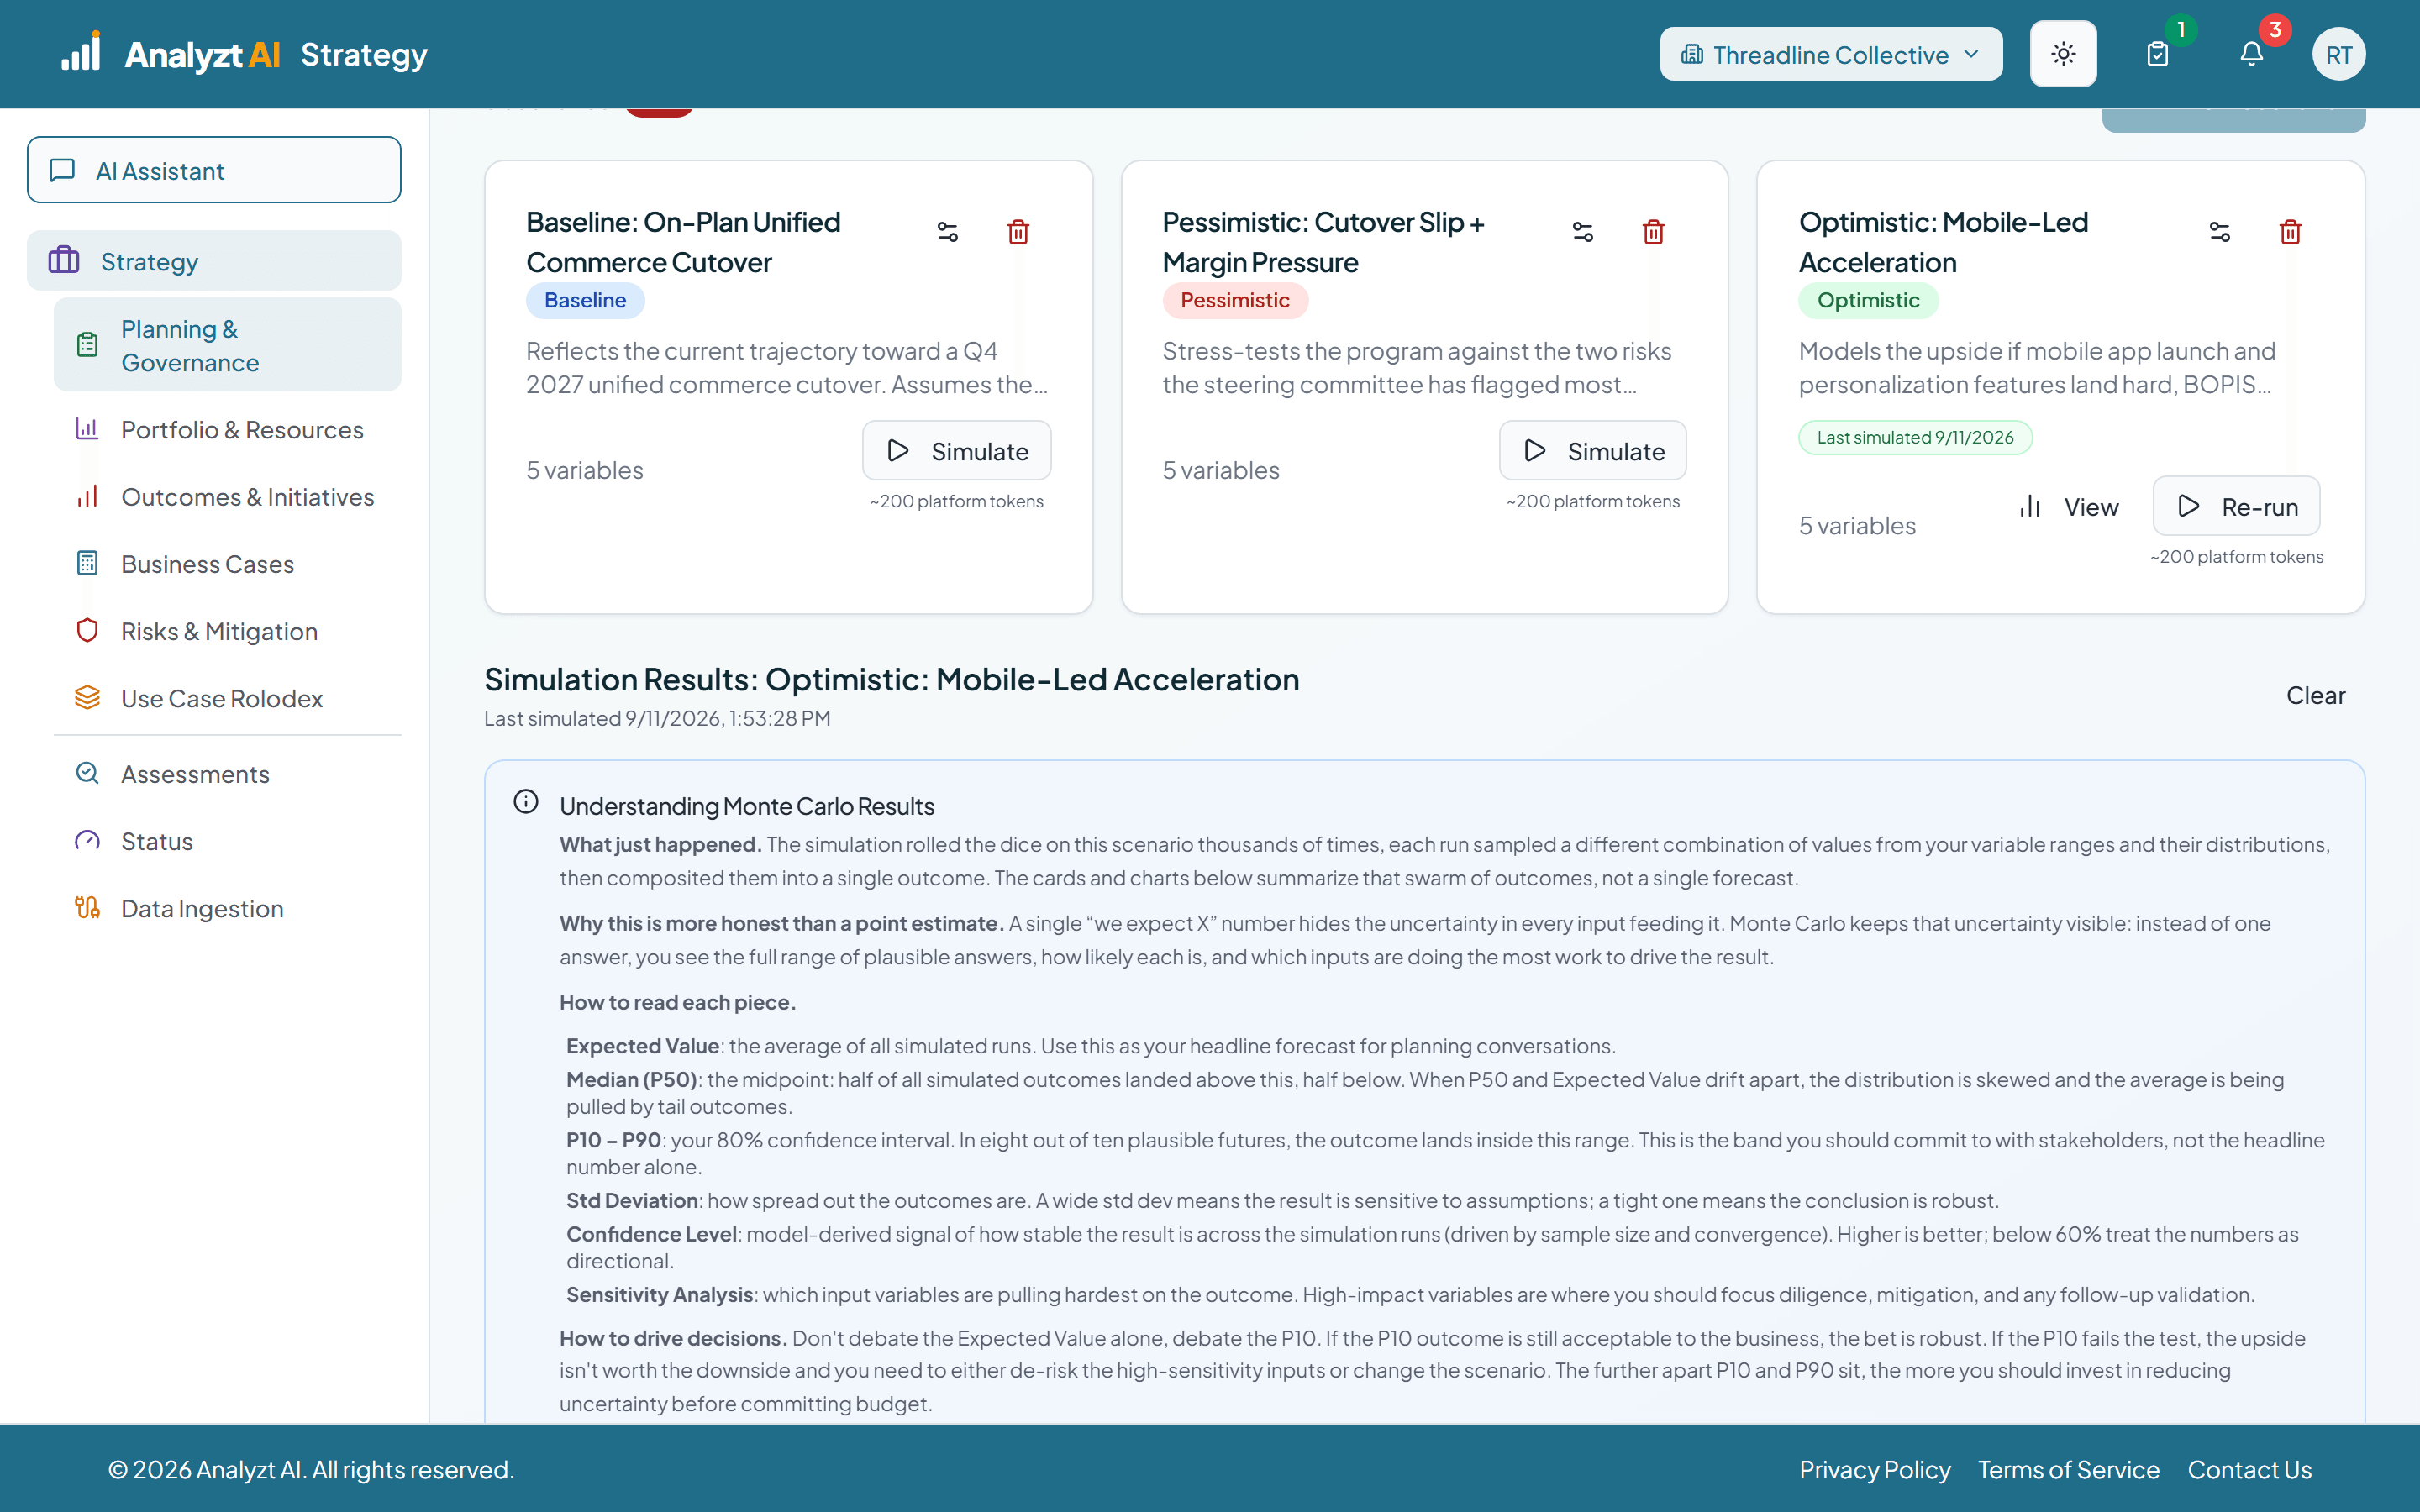 ~3 min
Finance · Executive
A Range, Not a Number
Monte Carlo across the whole platform. Planning scenarios, a single business case, the business case portfolio, the risk register and the outcome optimizer, with what each range is telling you and what to do about it.
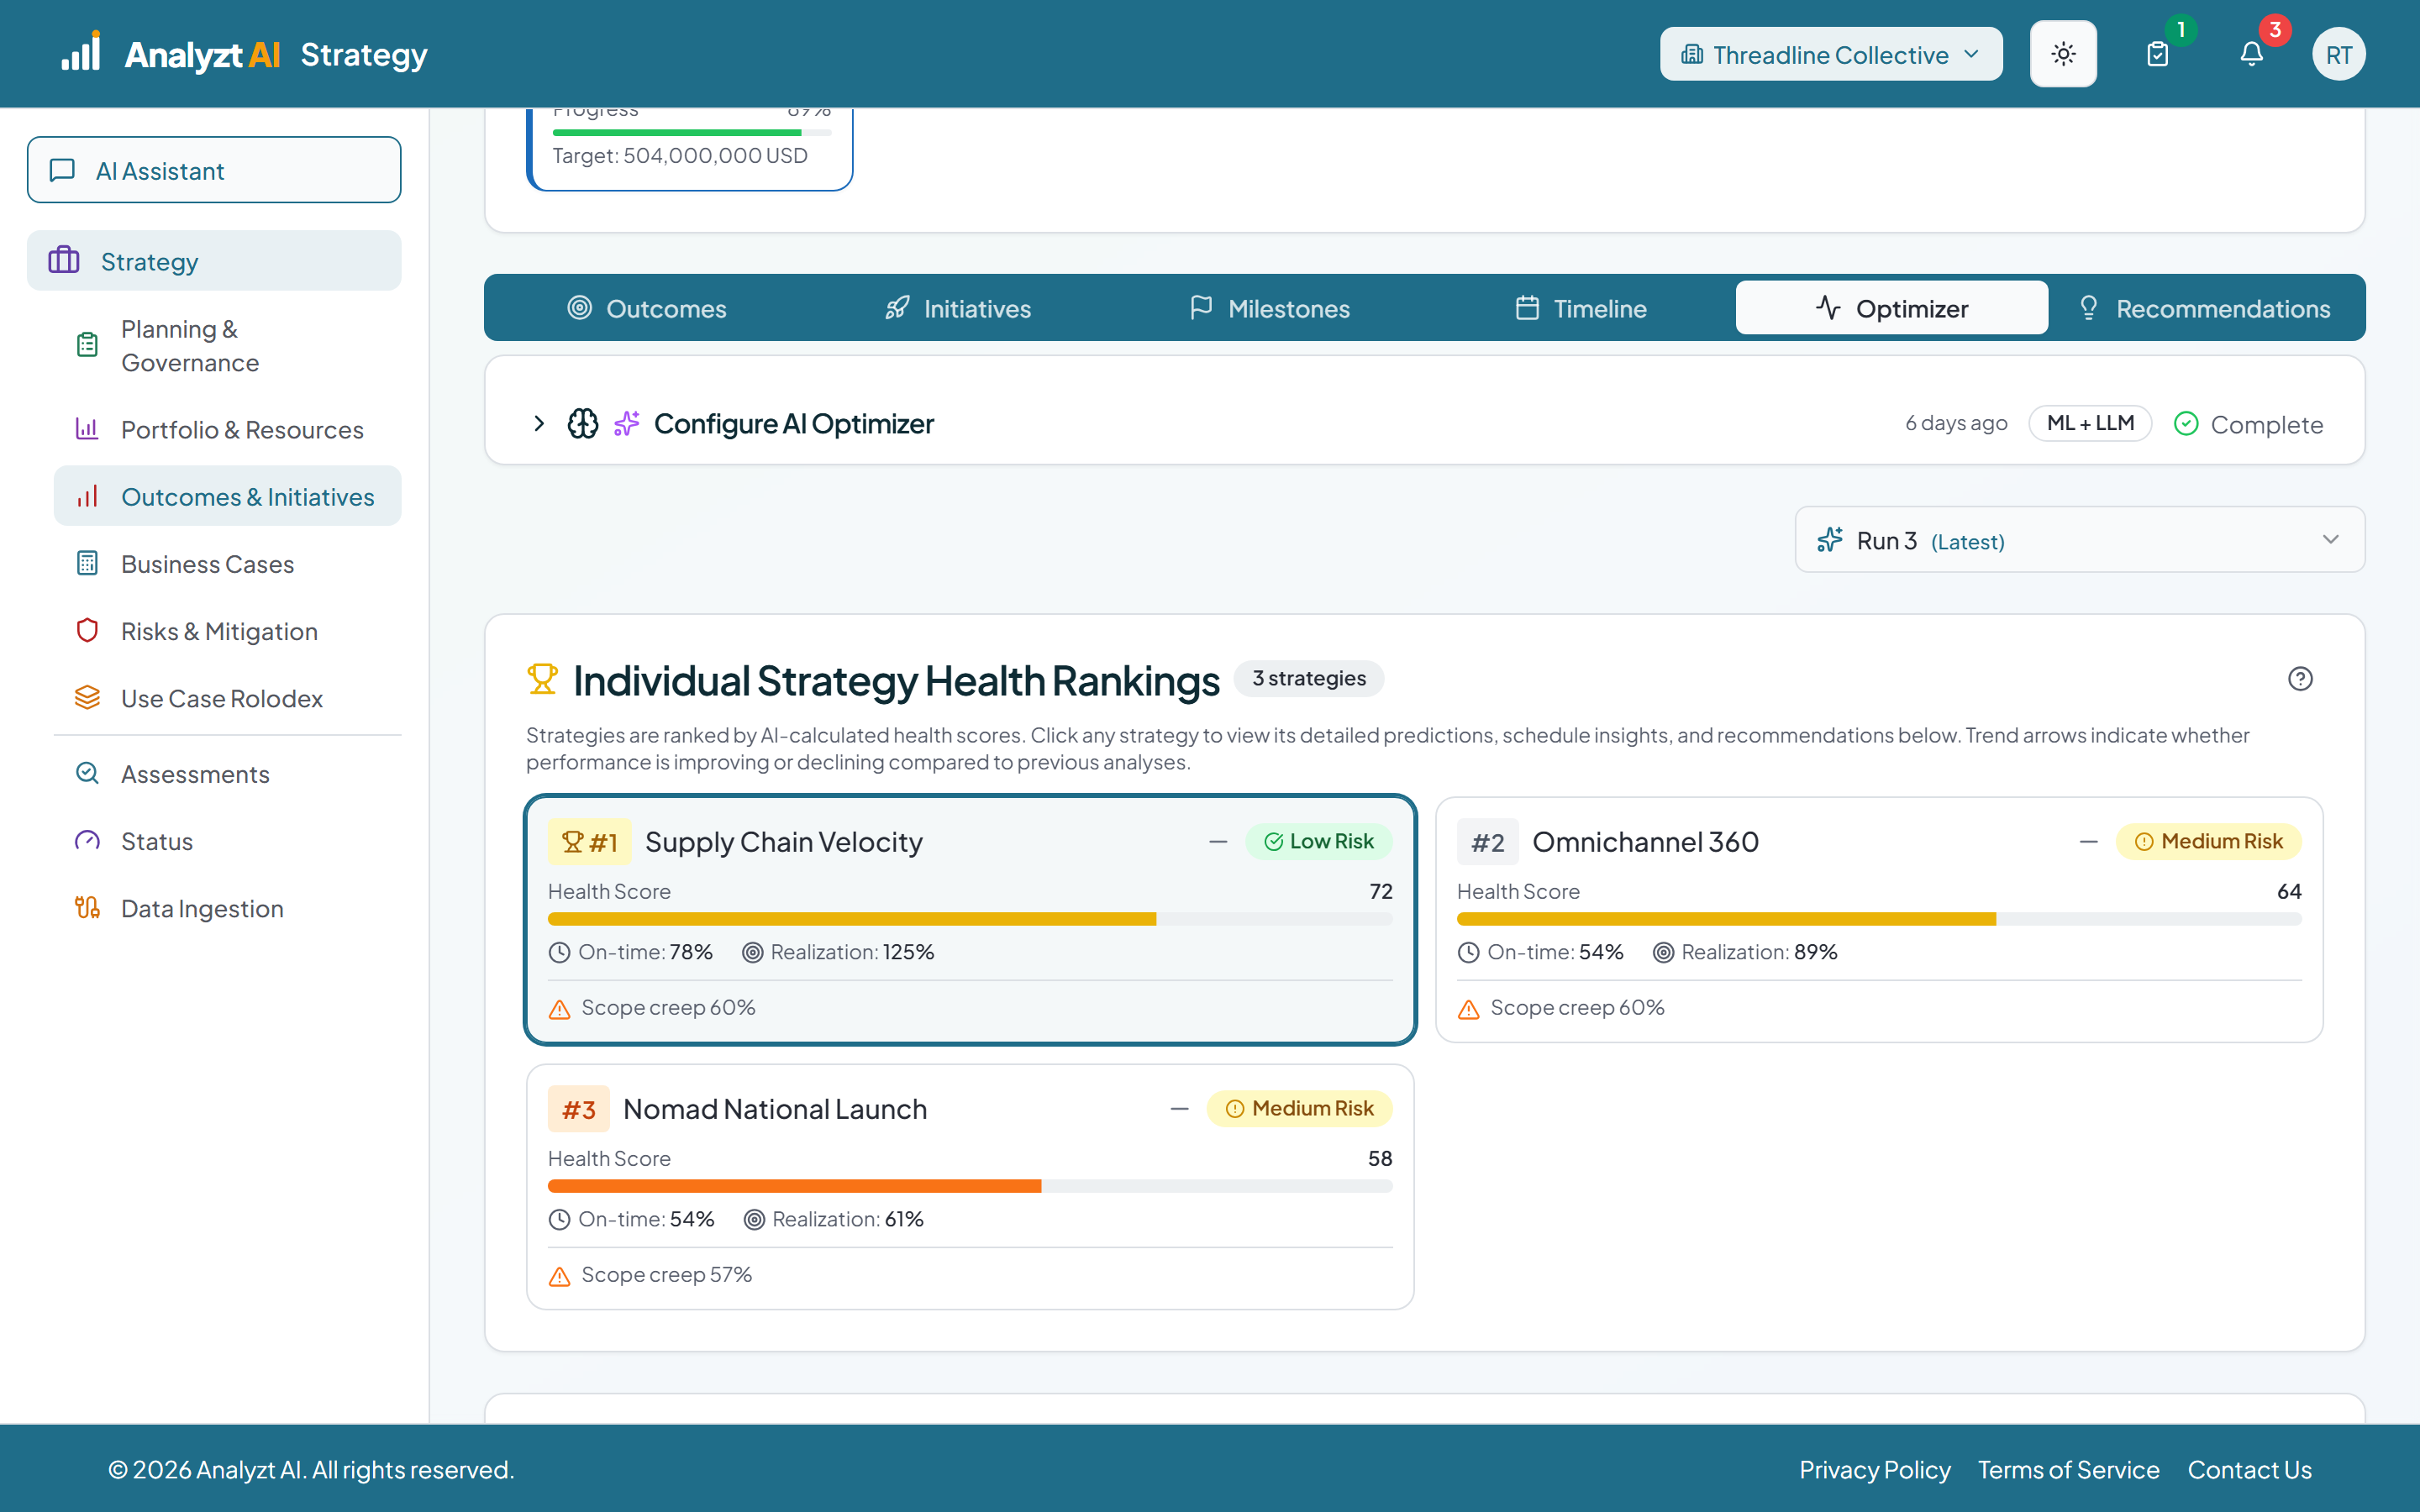 ~1 min
Strategy lead
The Outcome and Initiative Optimizer
Health scores, predictions for every outcome, initiative and milestone, the inputs that drove them, and how confidence falls as the horizon lengthens.
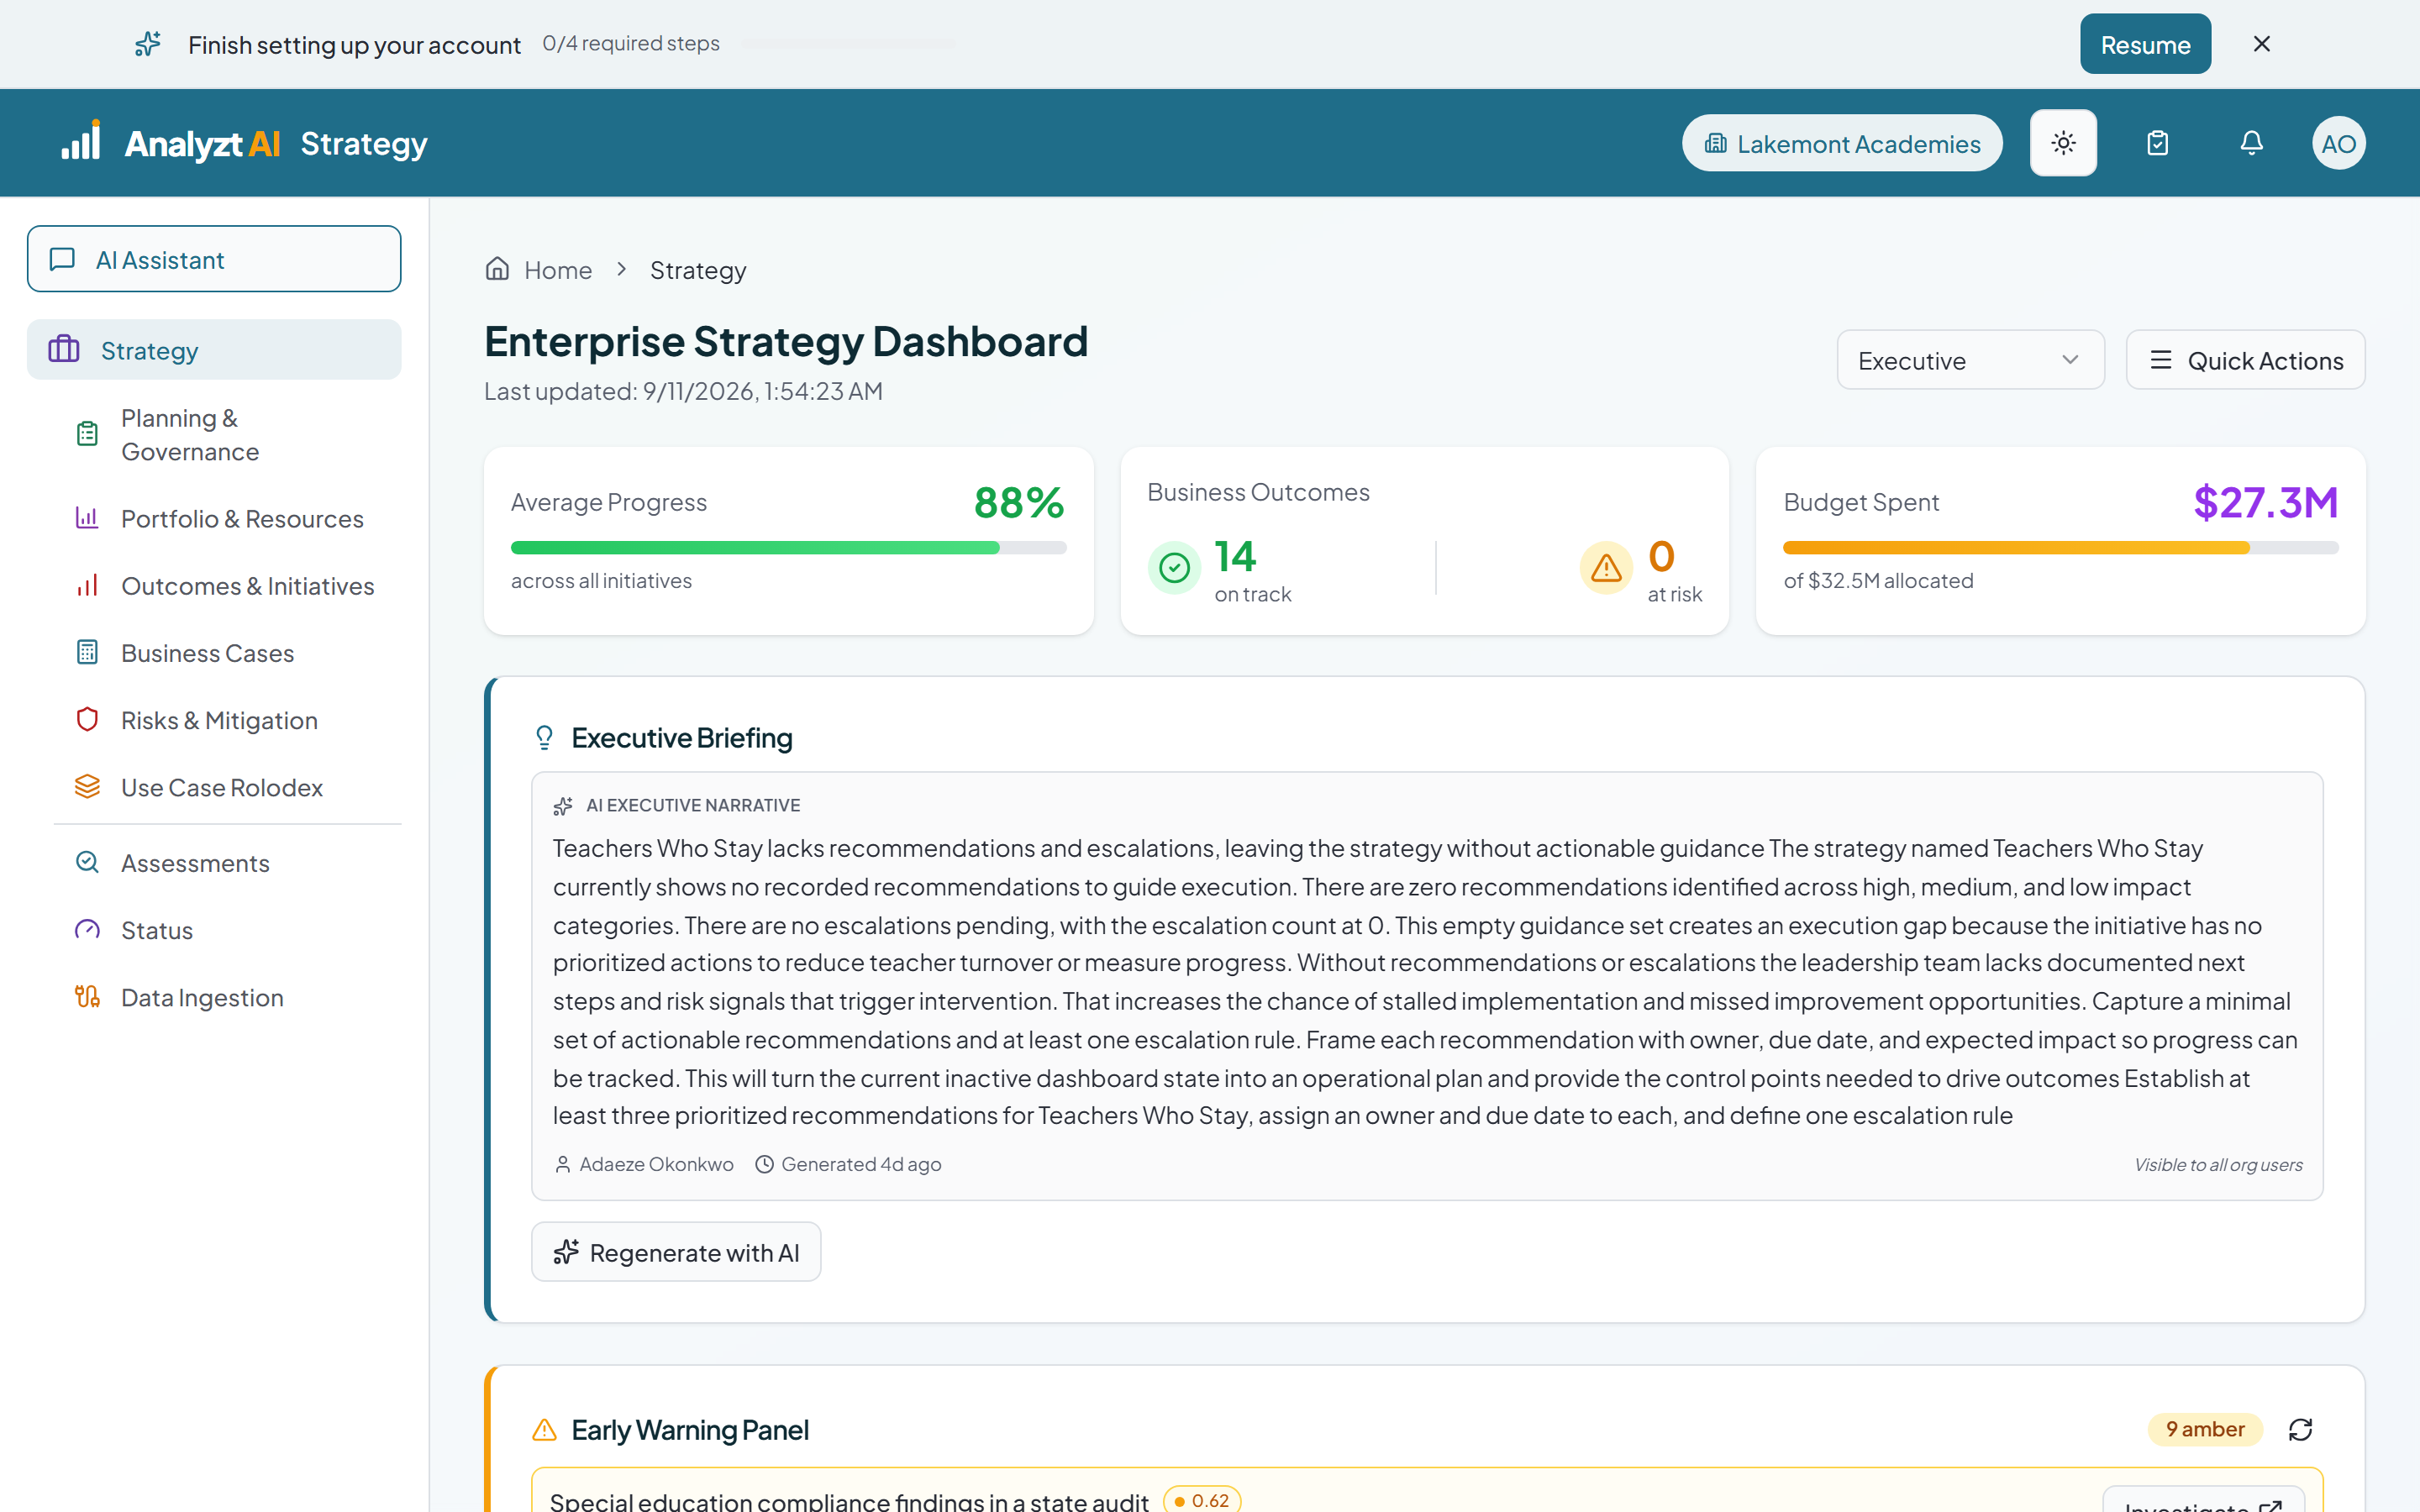 ~1 min
Executive · Strategy lead
What the Models Flag First
Predictions, risk alerts and priority initiatives on the landing screen, each naming what the models expect to go wrong and the work it points at.
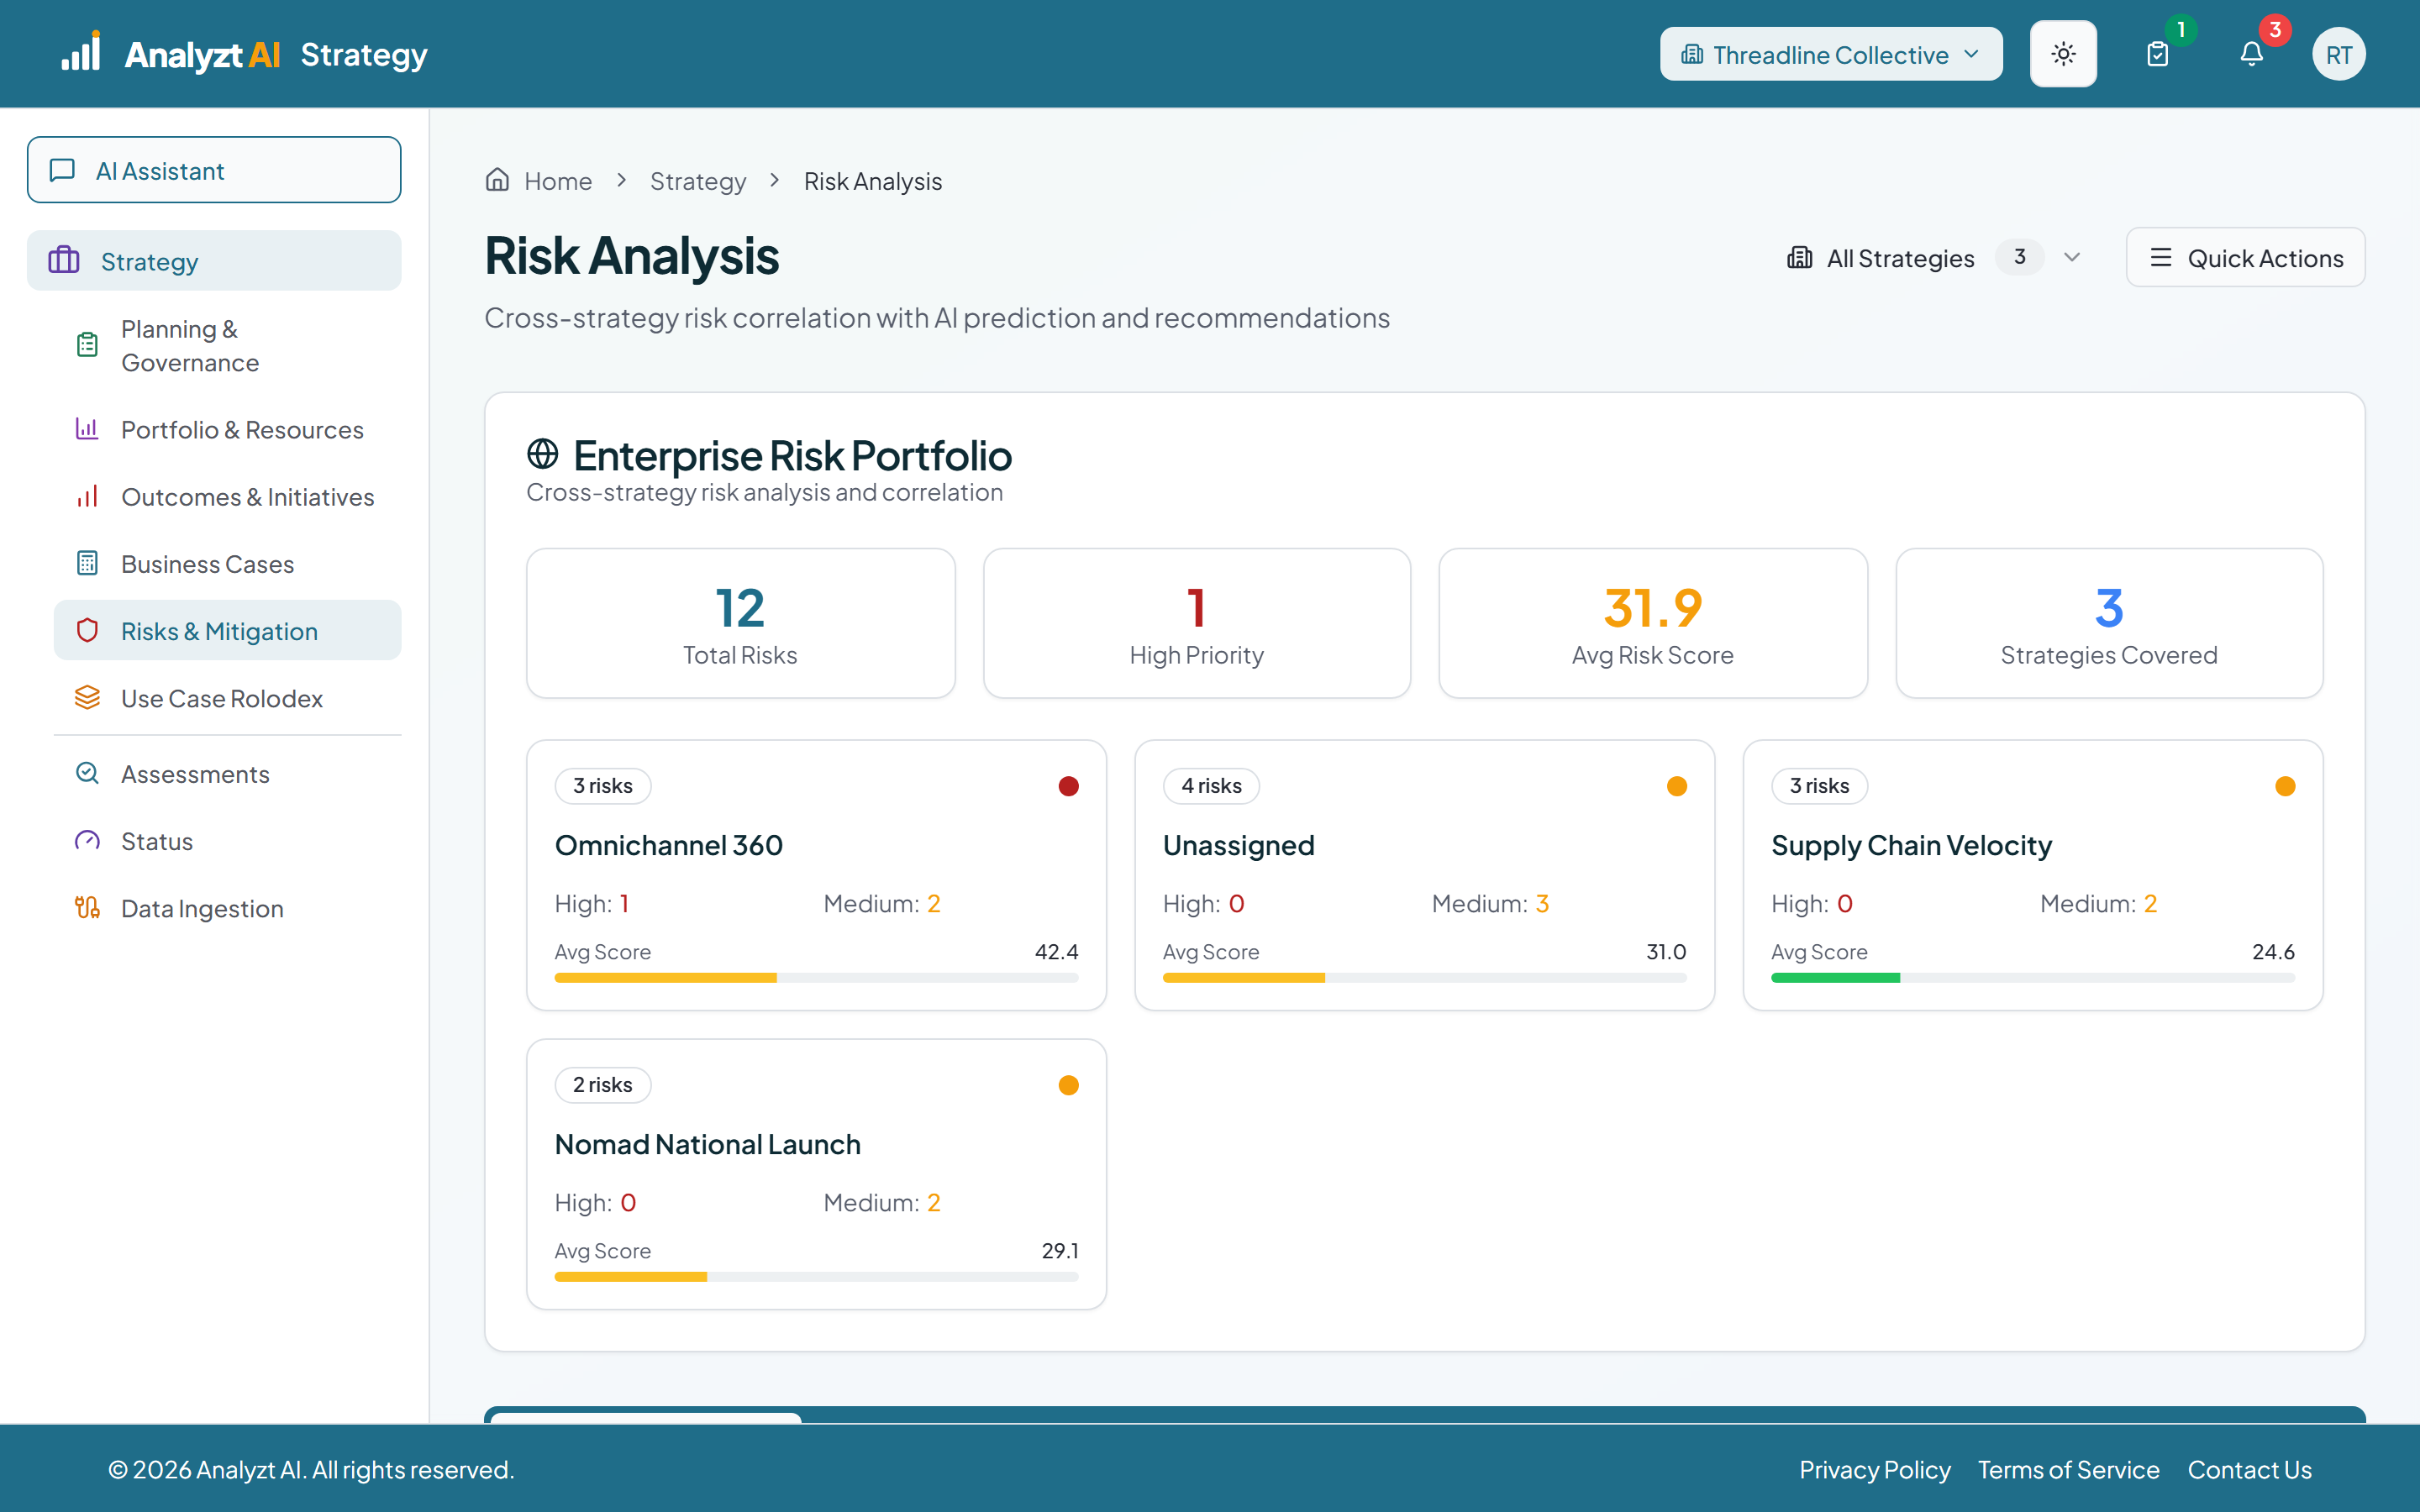 ~1 min
Executive · Strategy lead
Risks You Can Actually Price
A risk register nobody reads is just a list. These are scored, ranked, attached to the work they threaten, and measured against an appetite you set.
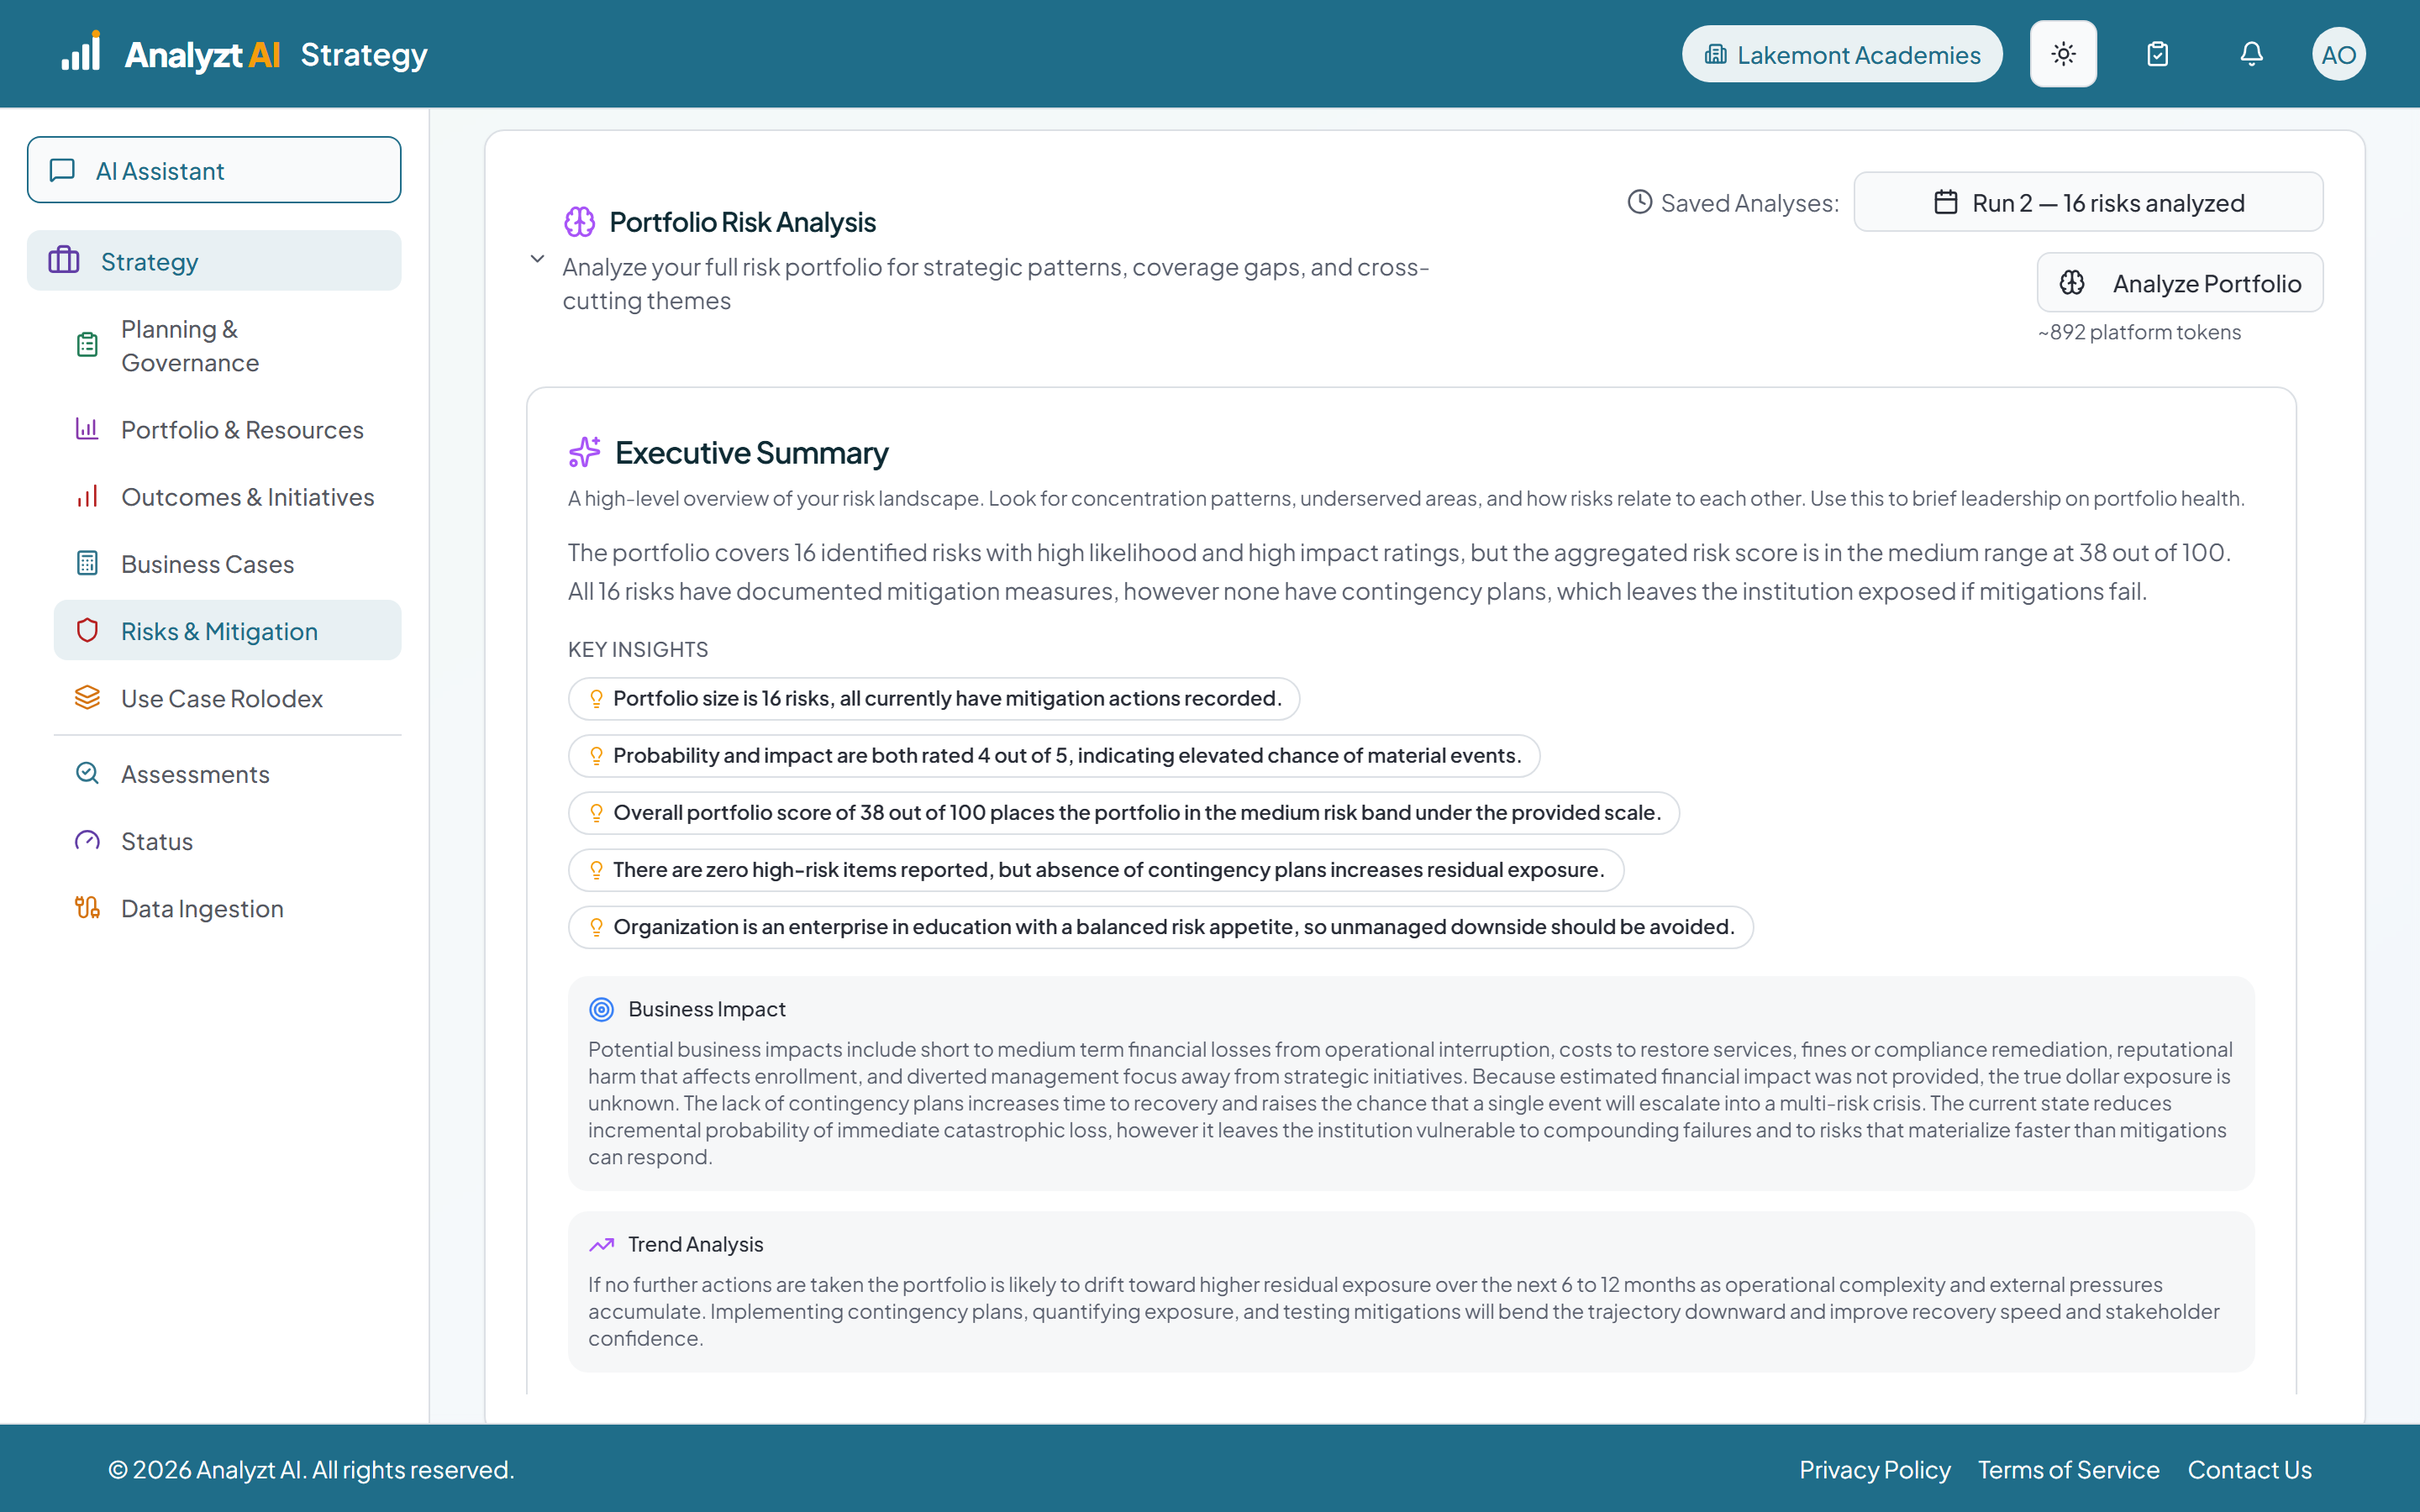 ~1 min
Strategy lead · Executive
Risk, Scored and Forecast
Four models run against the register in one pass. A score for probability, impact and velocity, a category assigned from an industry framework, a thirty sixty ninety day trend, and a direction for every risk. All of it reviewable and overridable.
 ~1 min
Strategy lead
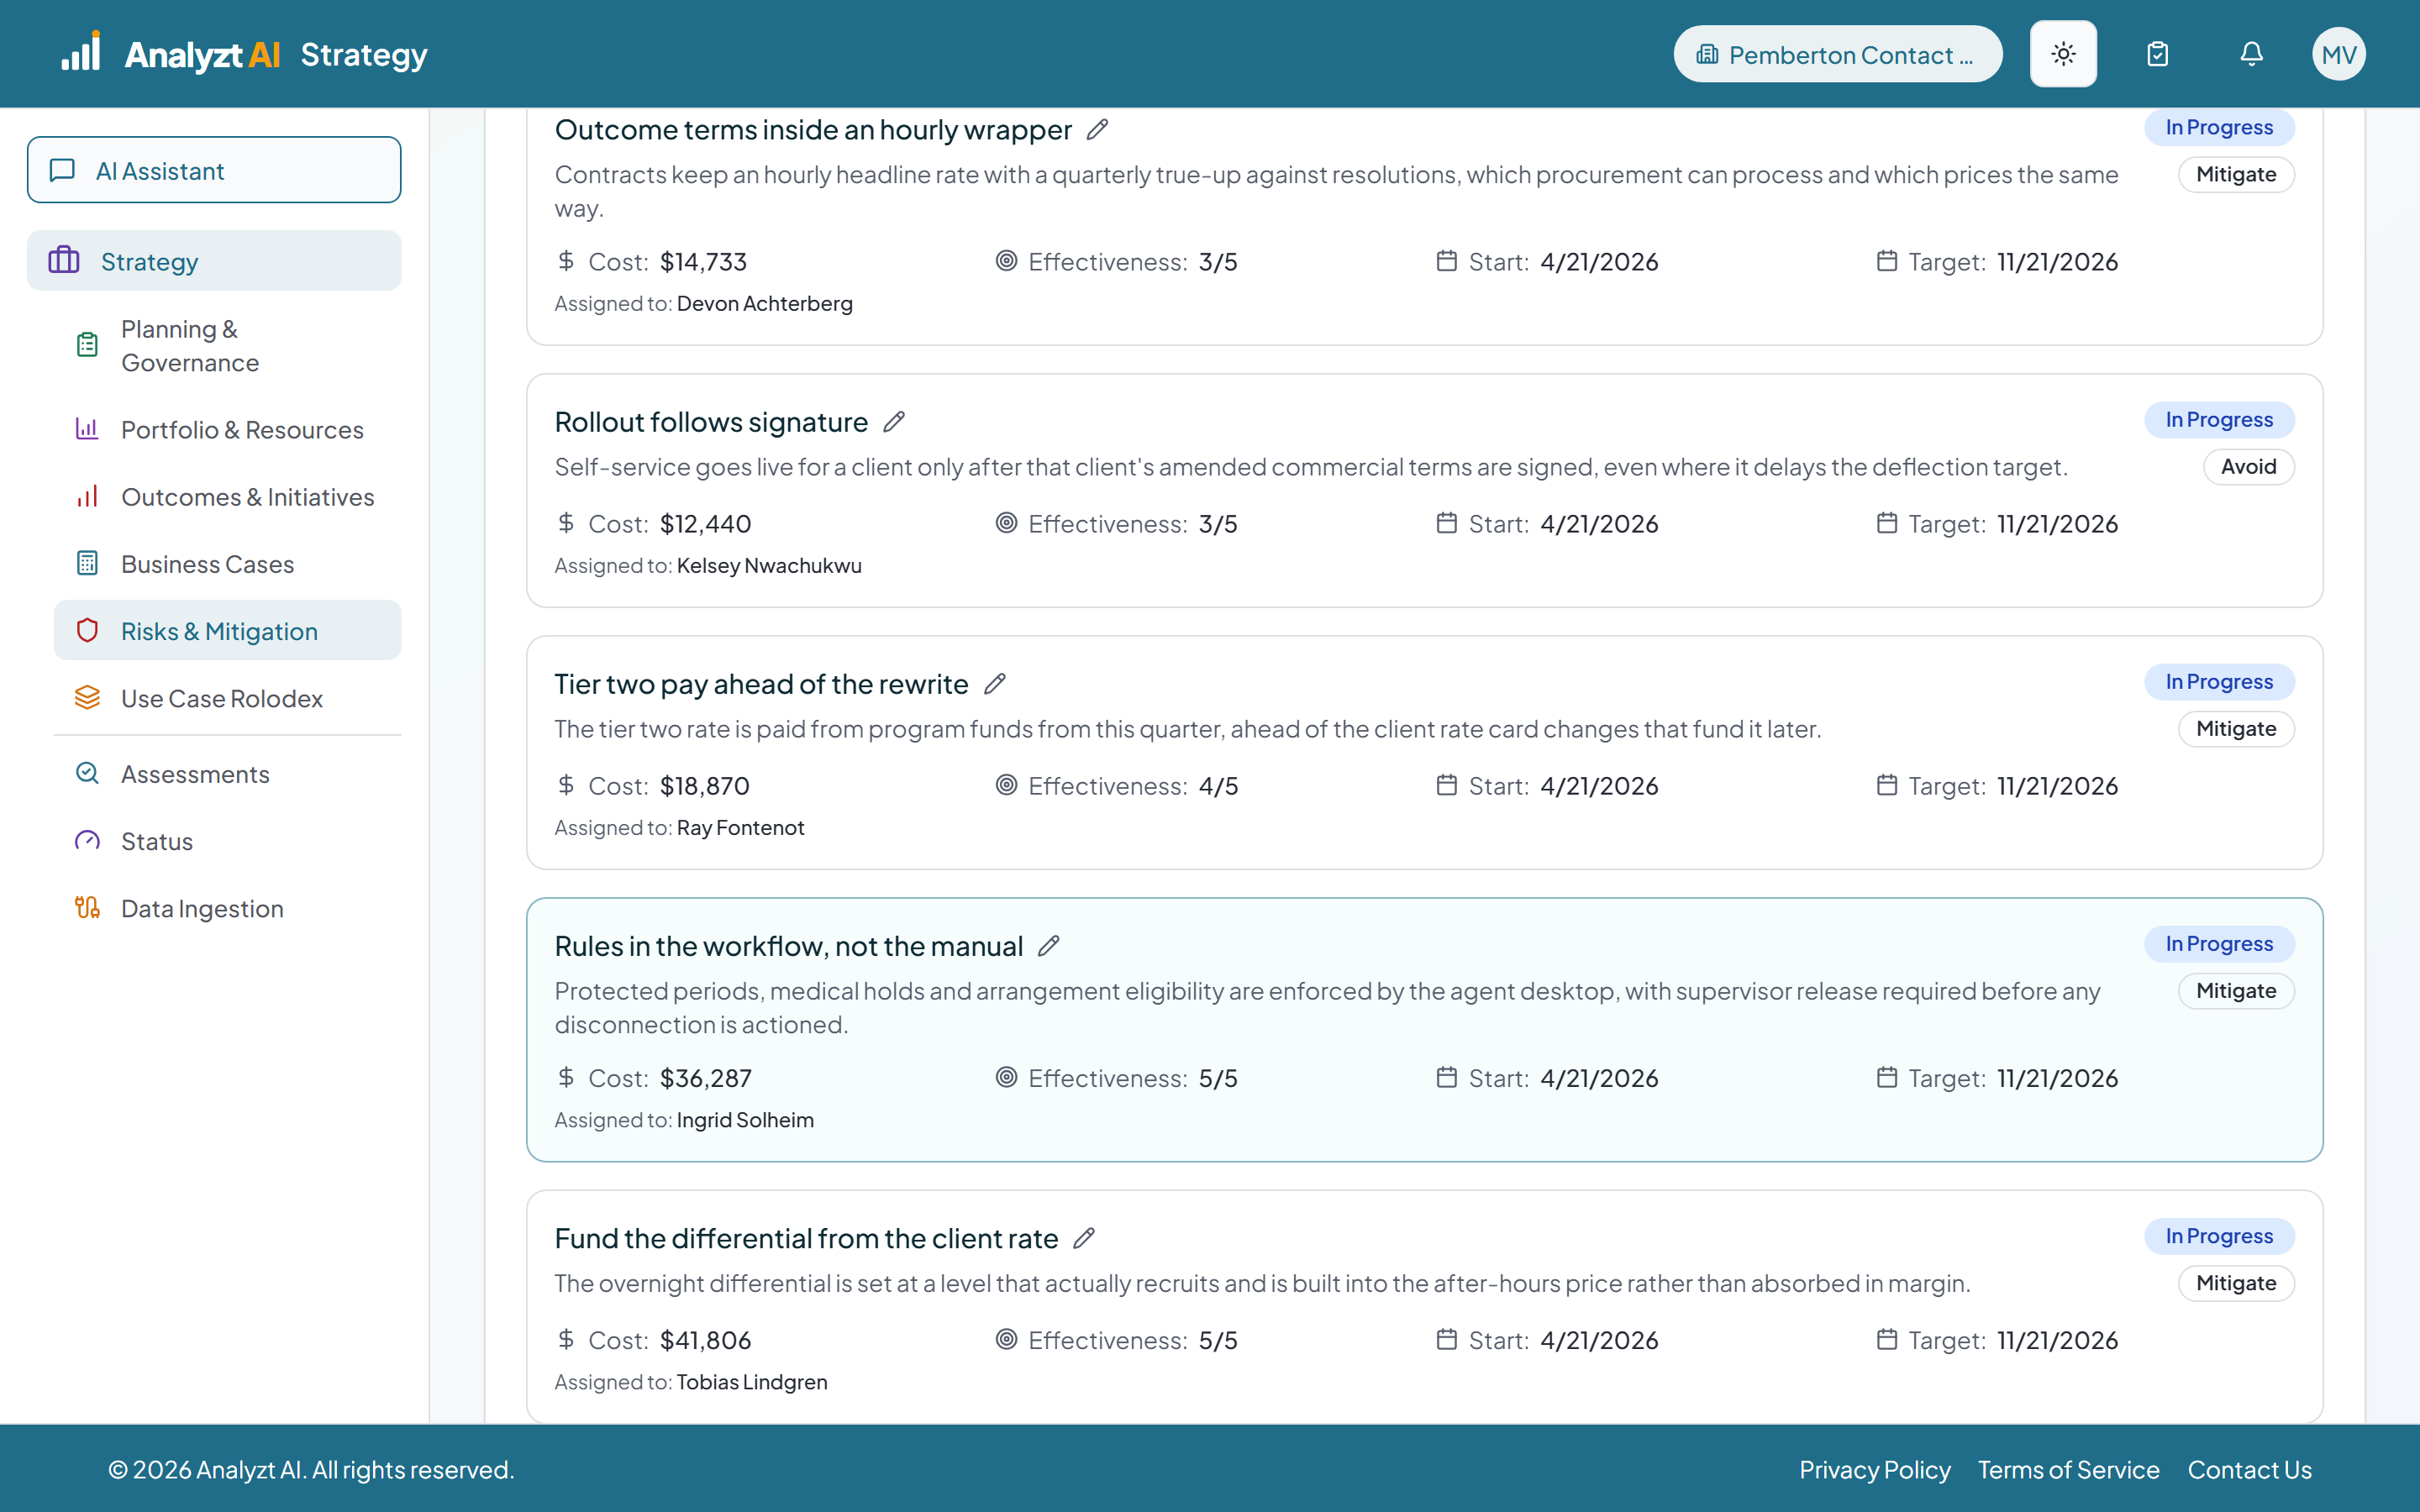
Mitigation With a Number On It
Each mitigation carries an estimated cost, an effectiveness rating you set, an owner, a status and a target date. Appetite sets the threshold it is judged against, and monitoring reports compliance by category rather than filing the plan away.
 ~2 min
Executive · Strategy lead
Scoring the Whole Portfolio
A deep dive into the portfolio optimizer results. The executive summary, eight scored dimensions with the stage the portfolio is in, the diagnostic chapters, where strategies reinforce each other, risks that cross more than one strategy, and the sequence the run proposes against the order you set.
 ~1 min
Strategy lead
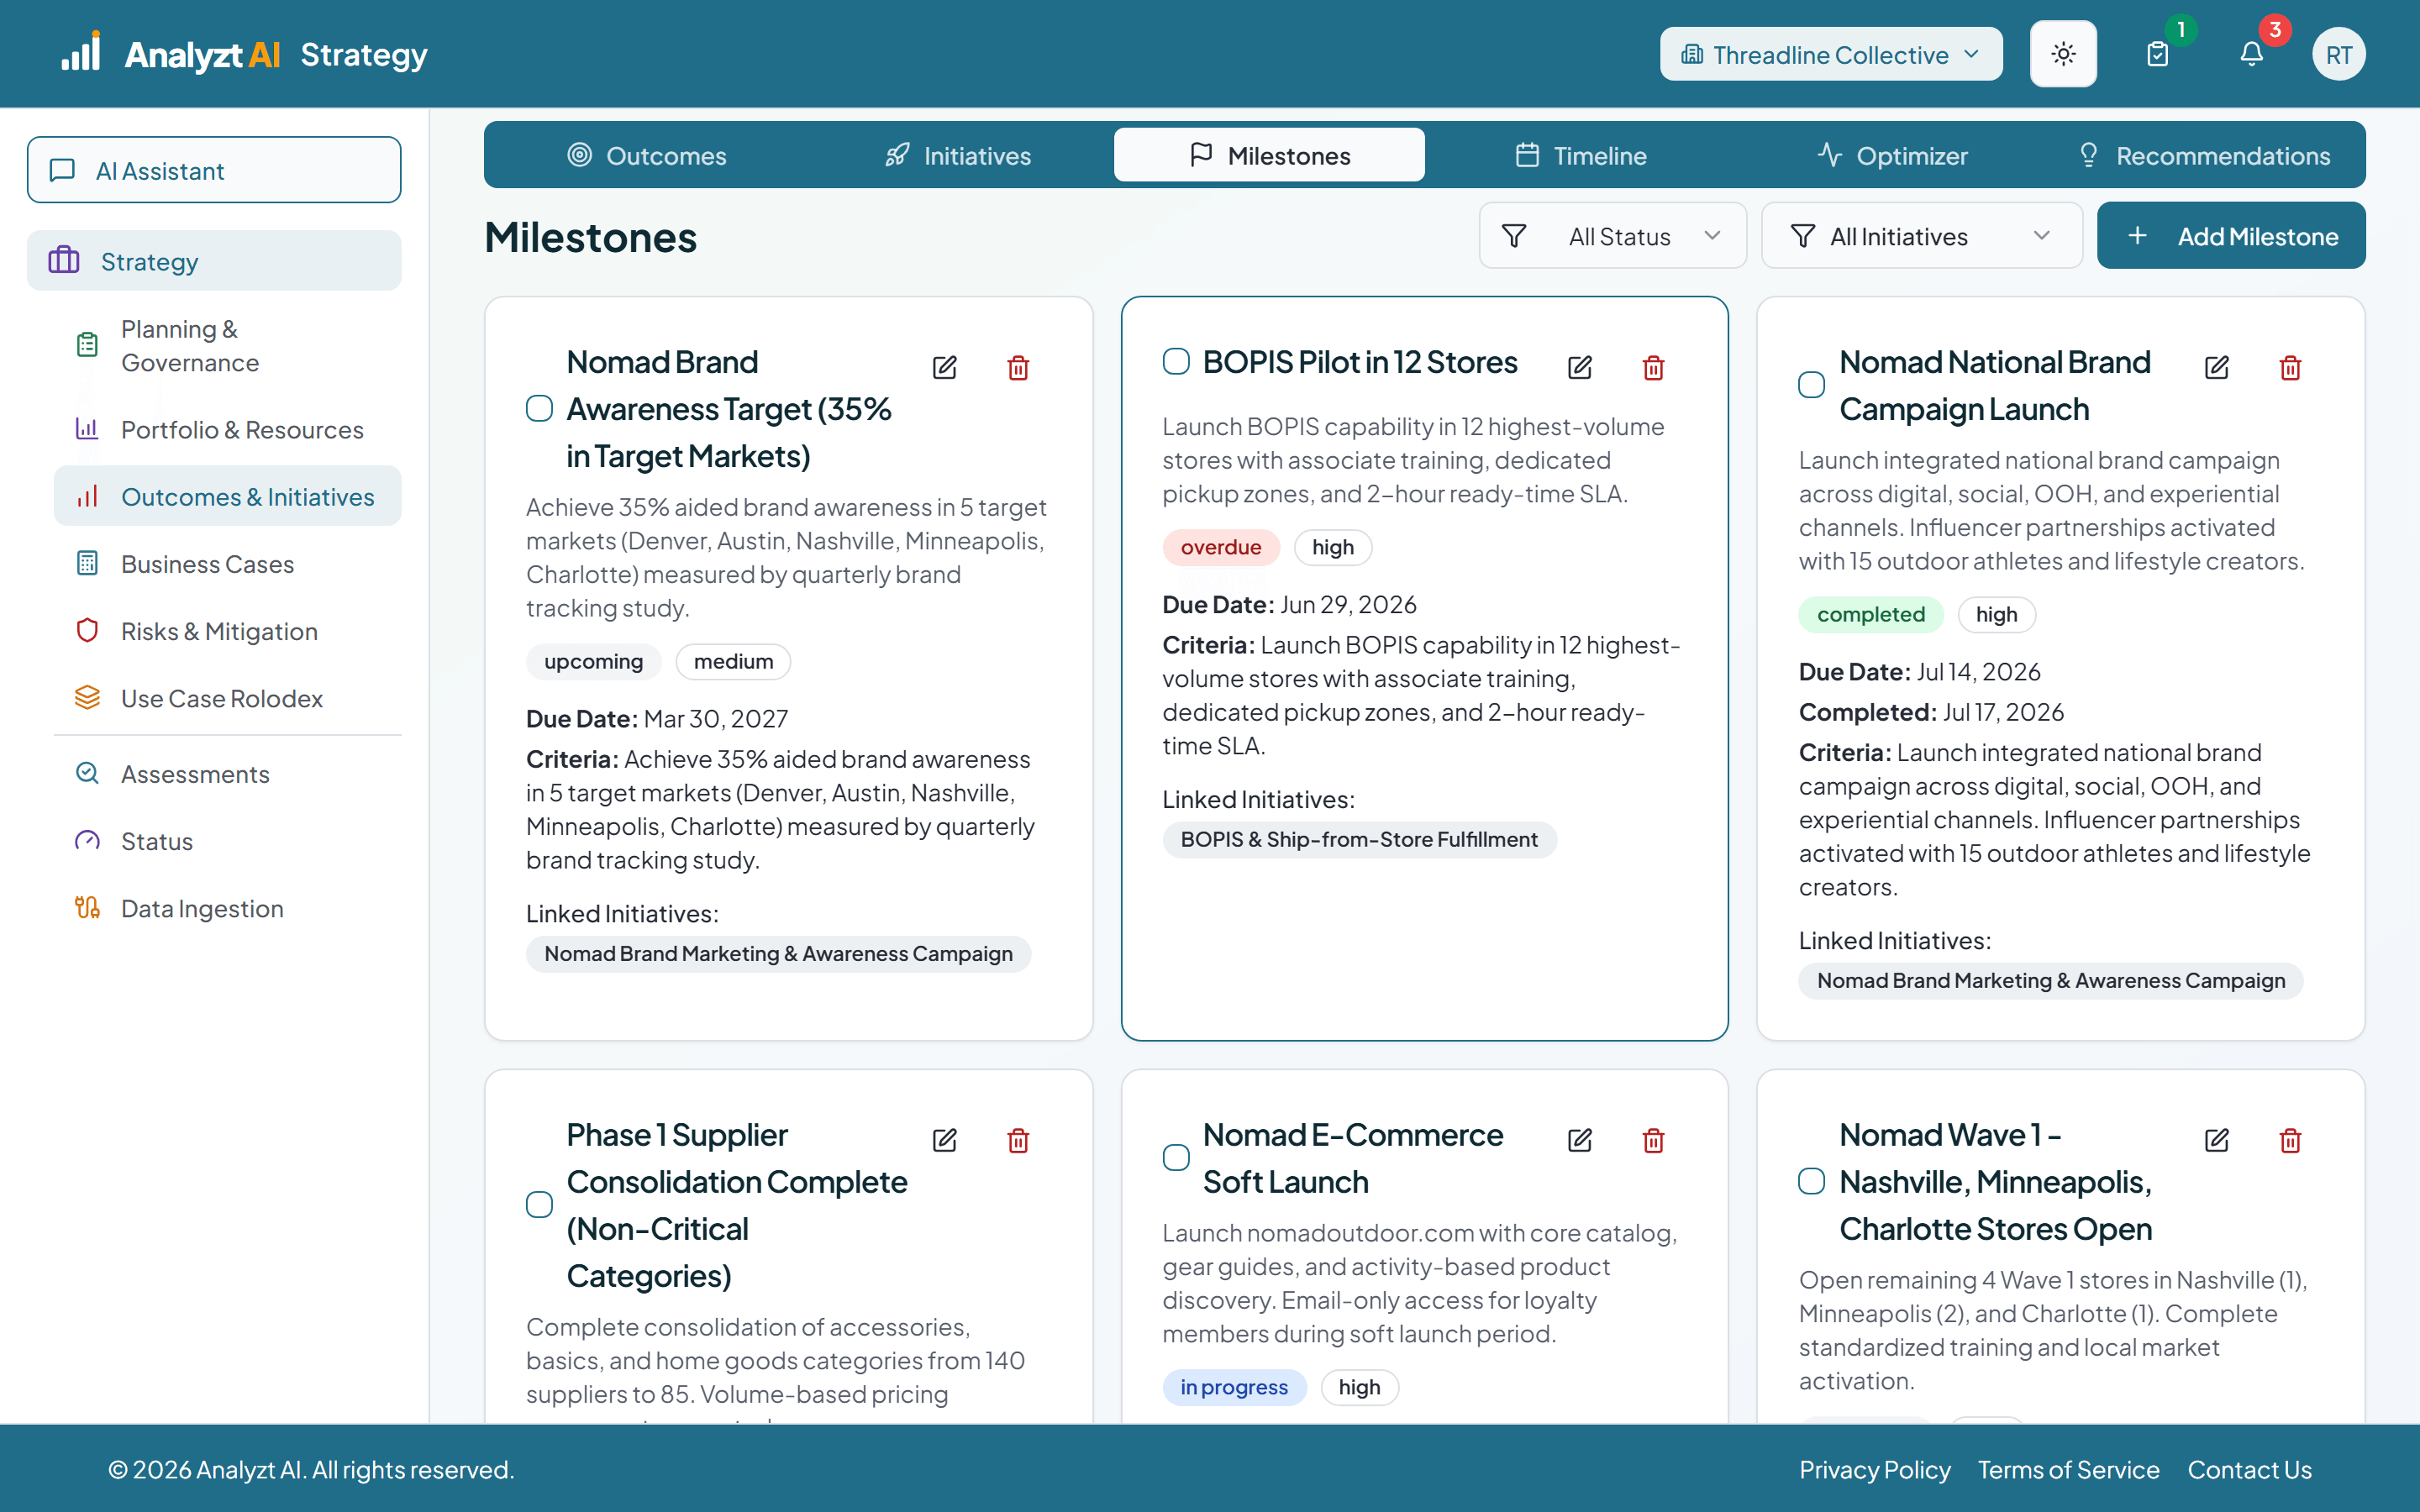
Will It Land On Time
The milestone register and the timeline show what was planned and what landed. The optimizer answers whether it will hold, with an on time probability, an outlook that degrades across horizons, and a specific schedule change to consider.
Execution
Execution covers delivery and measurement. The status view reports delivery confidence, a computed RAID log and milestone progress without anybody writing a report. Value realization compares promised value against delivered value at outcome, initiative and milestone level.
8 demos
about 11 min
 ~2 min
Executive · Strategy lead
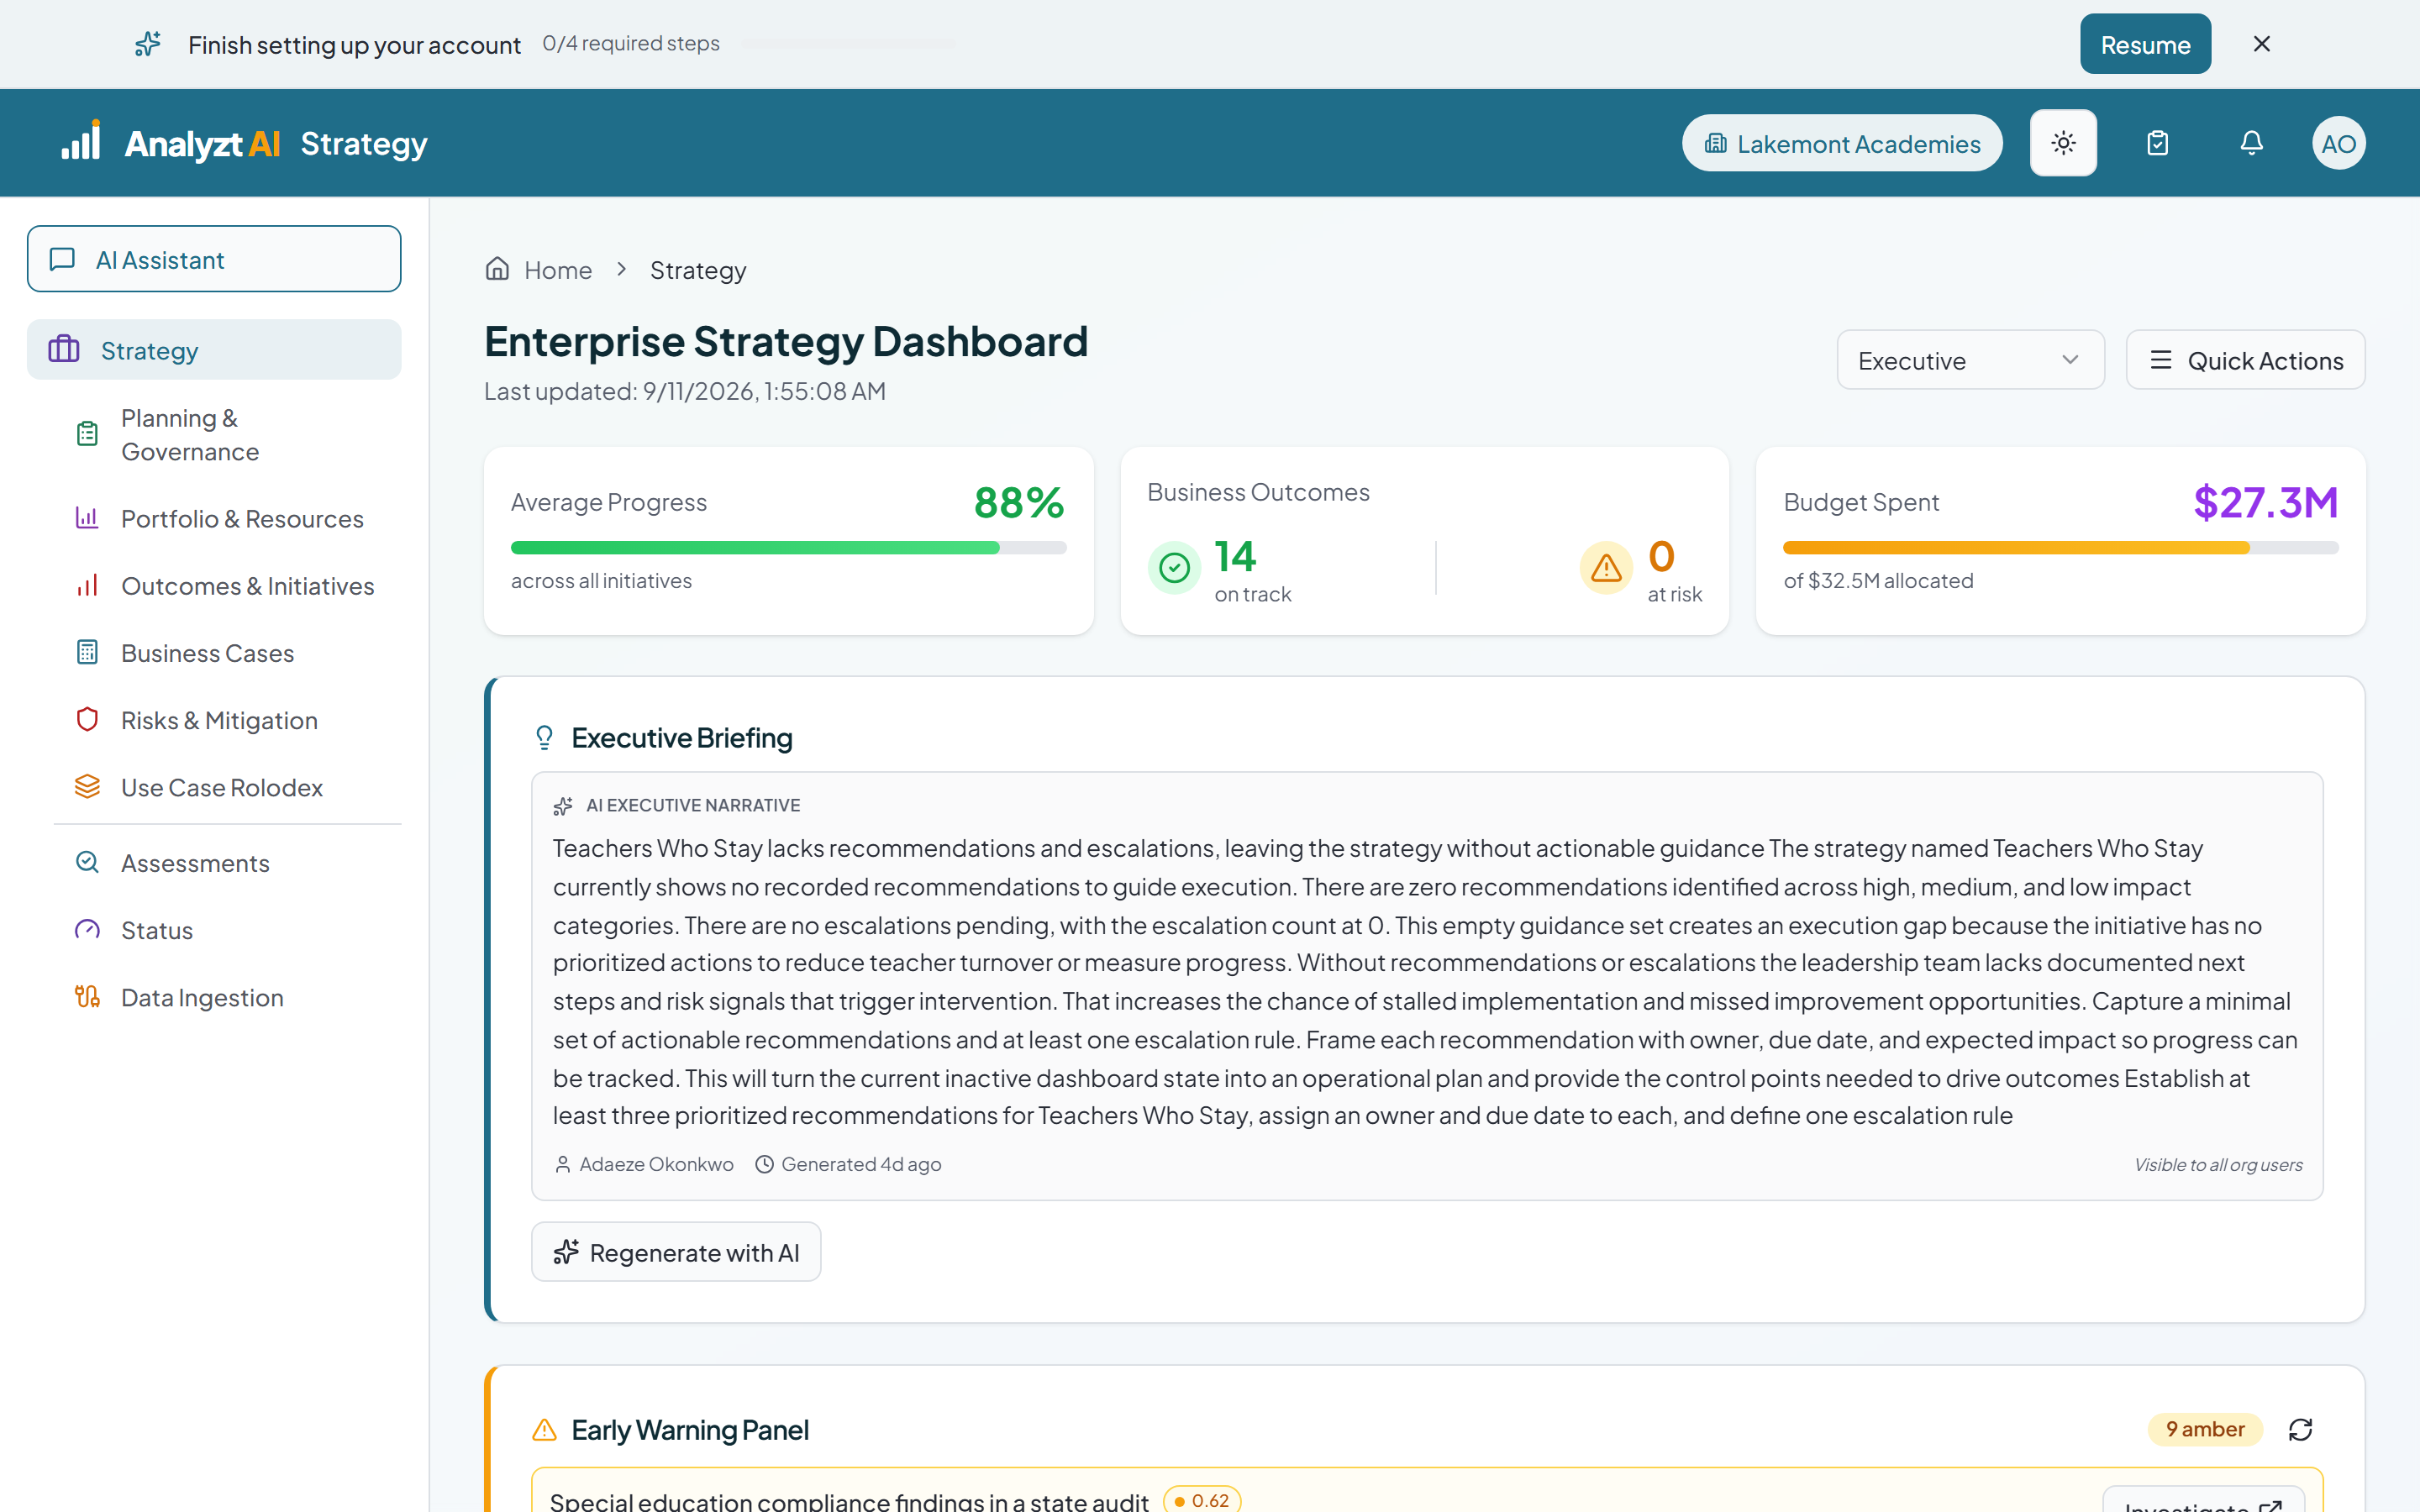
The Strategy Dashboard
The screen you land on. Score, outcome progress, financial performance, priority initiatives, benefits against promised, risk alerts and decisions, with the panel set chosen by the role you pick.
 ~1 min
Executive
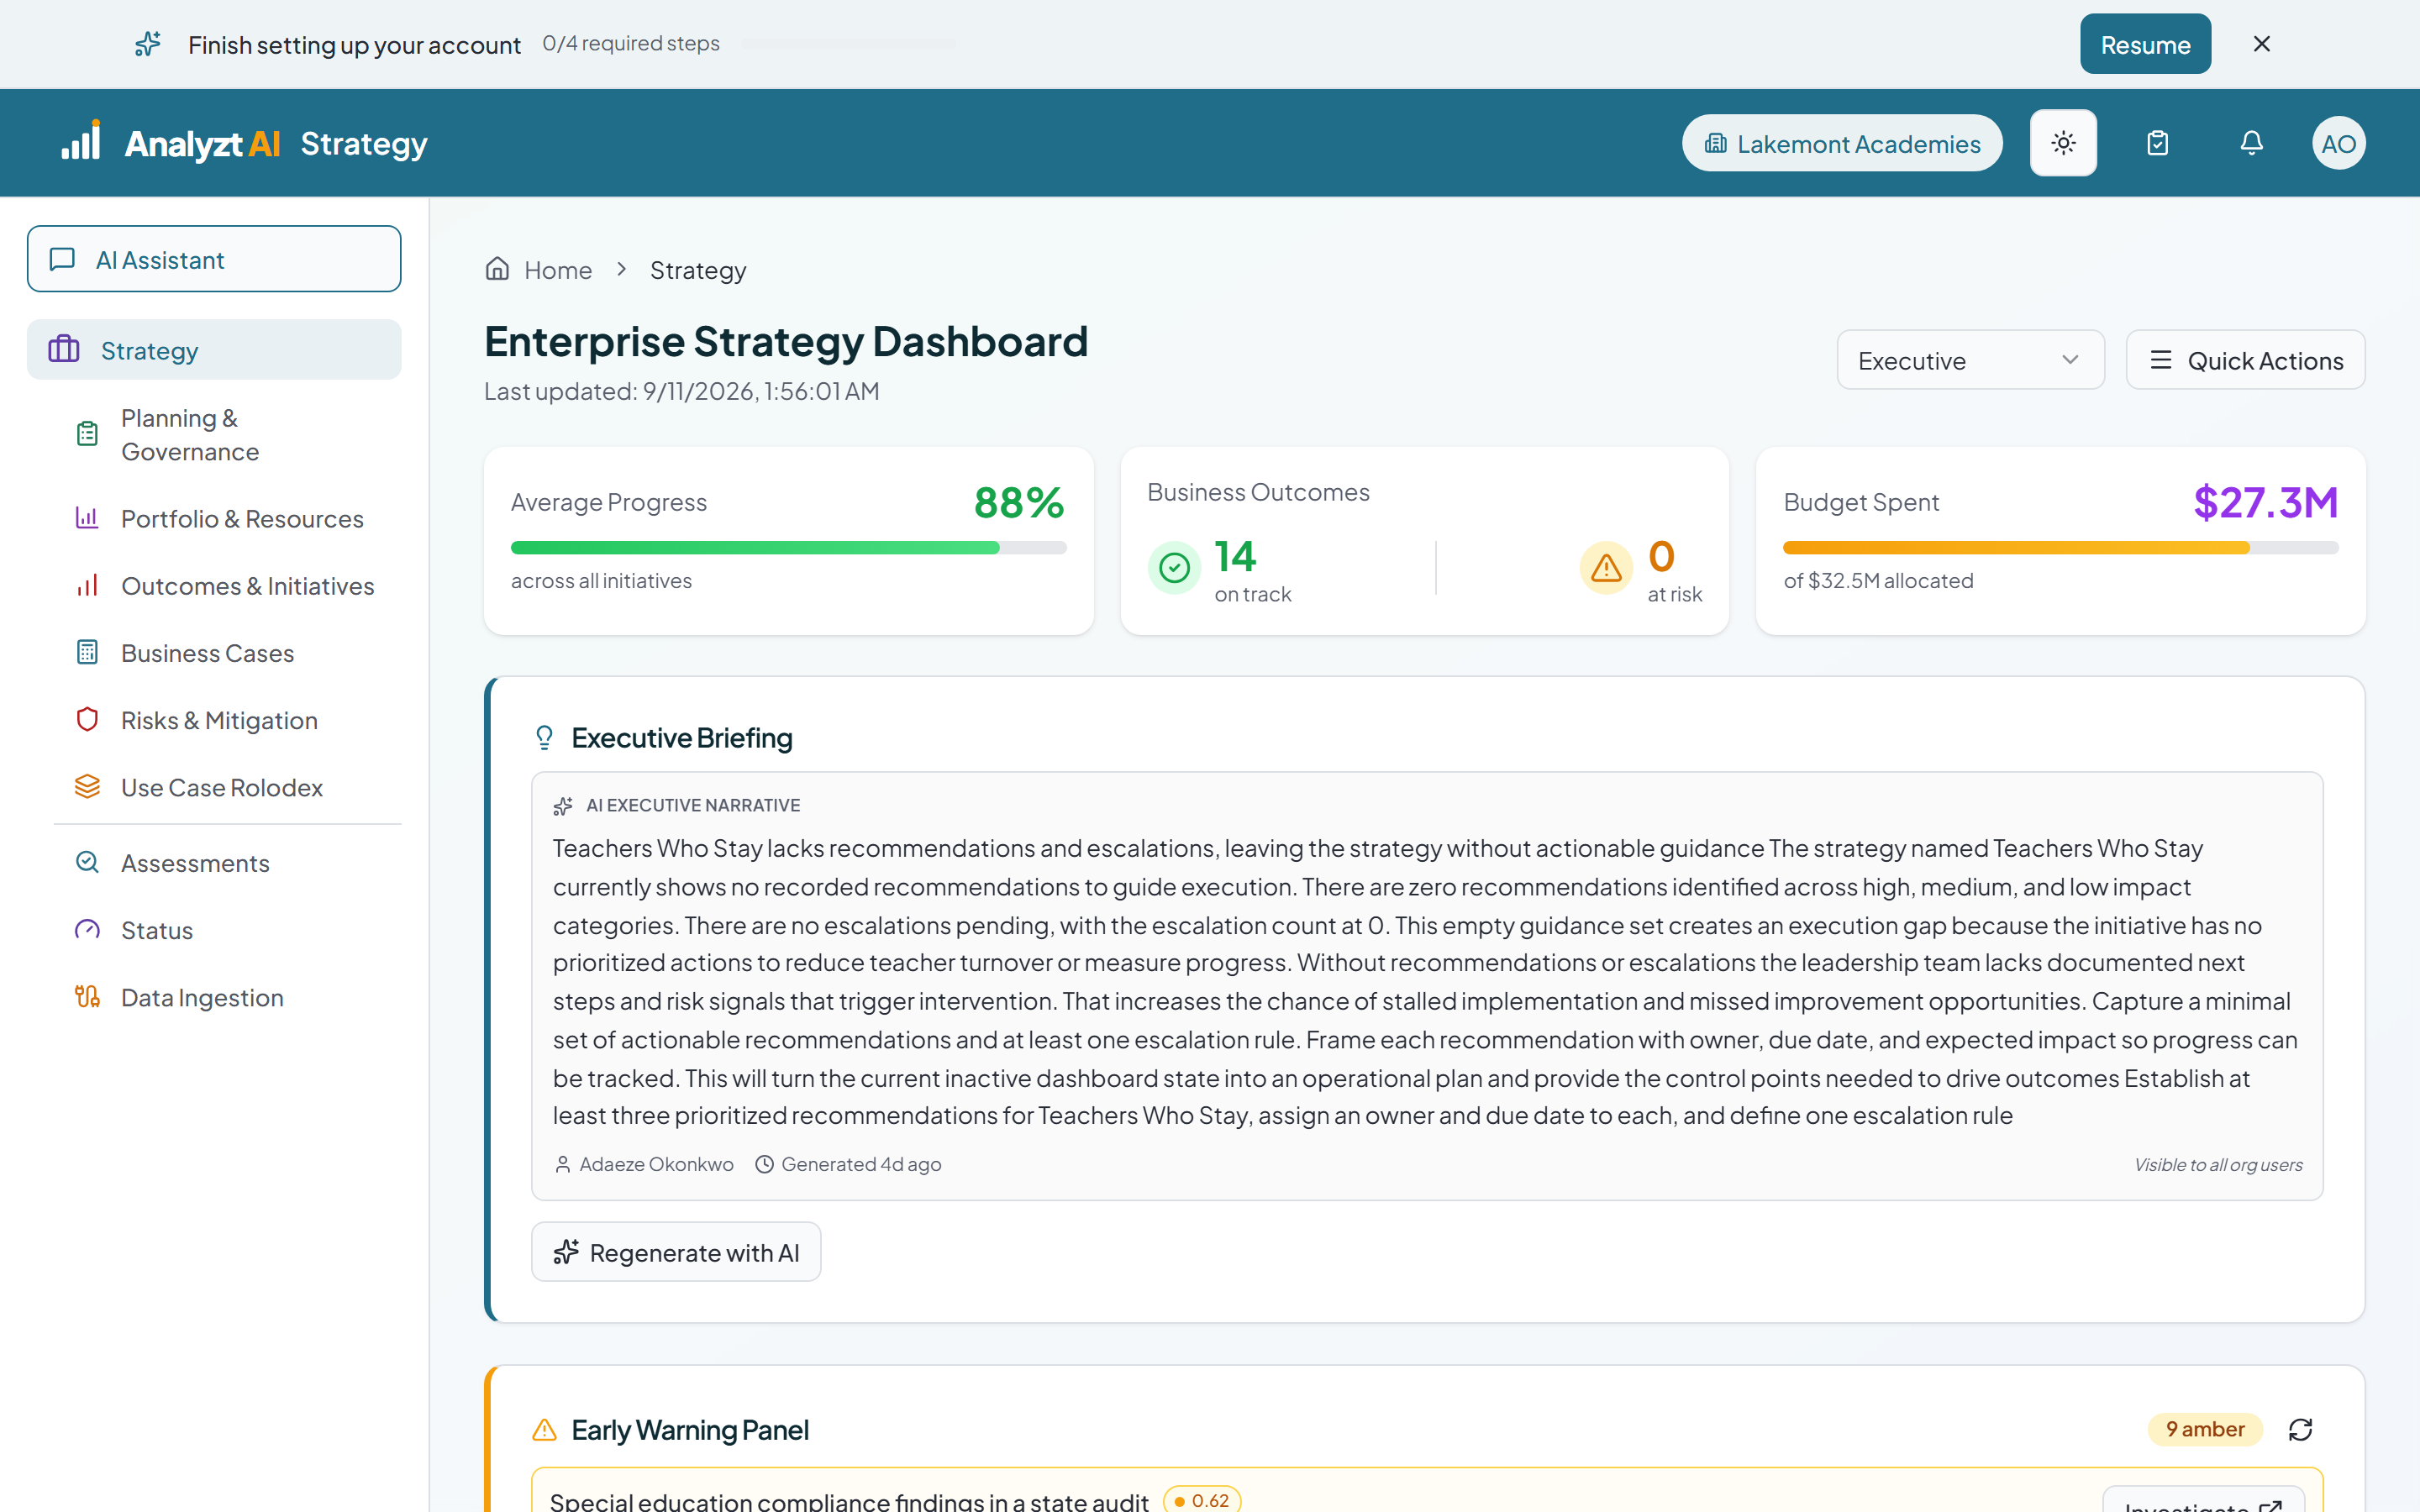
Your Queue
Decisions waiting on you by name, a written briefing on where the portfolio stands, and the risks and initiatives the platform would look at first.
 ~1 min
Executive
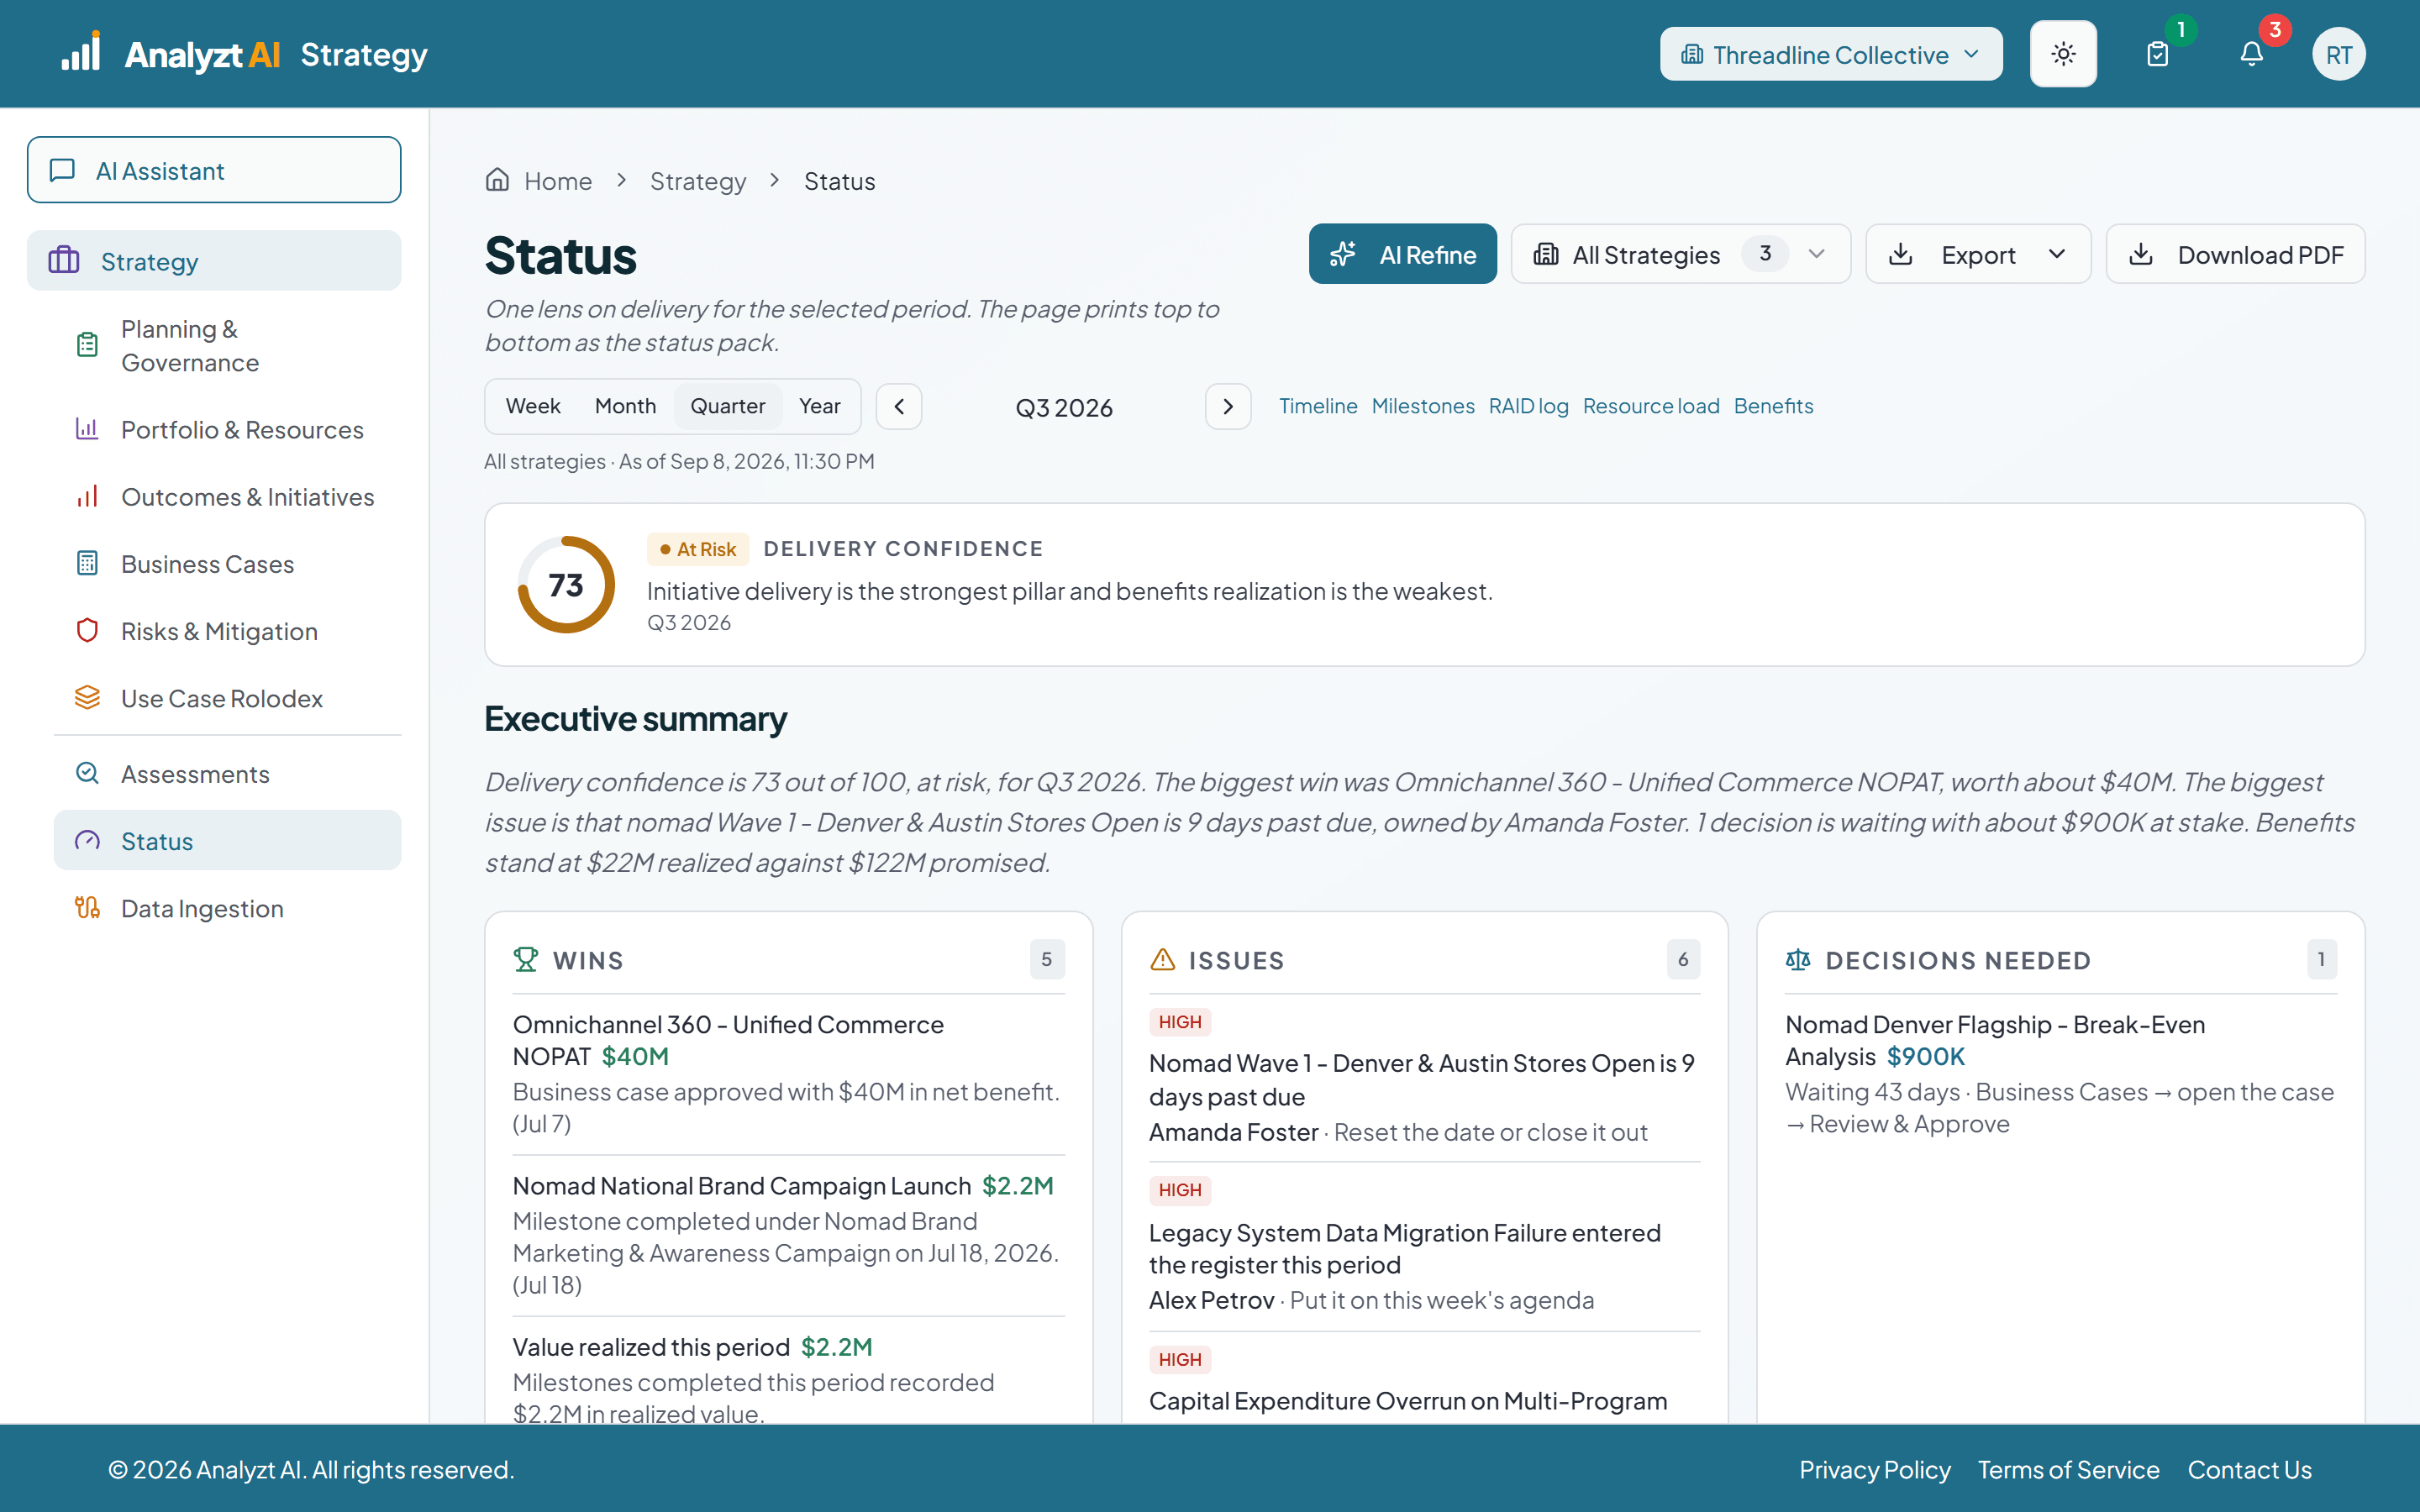
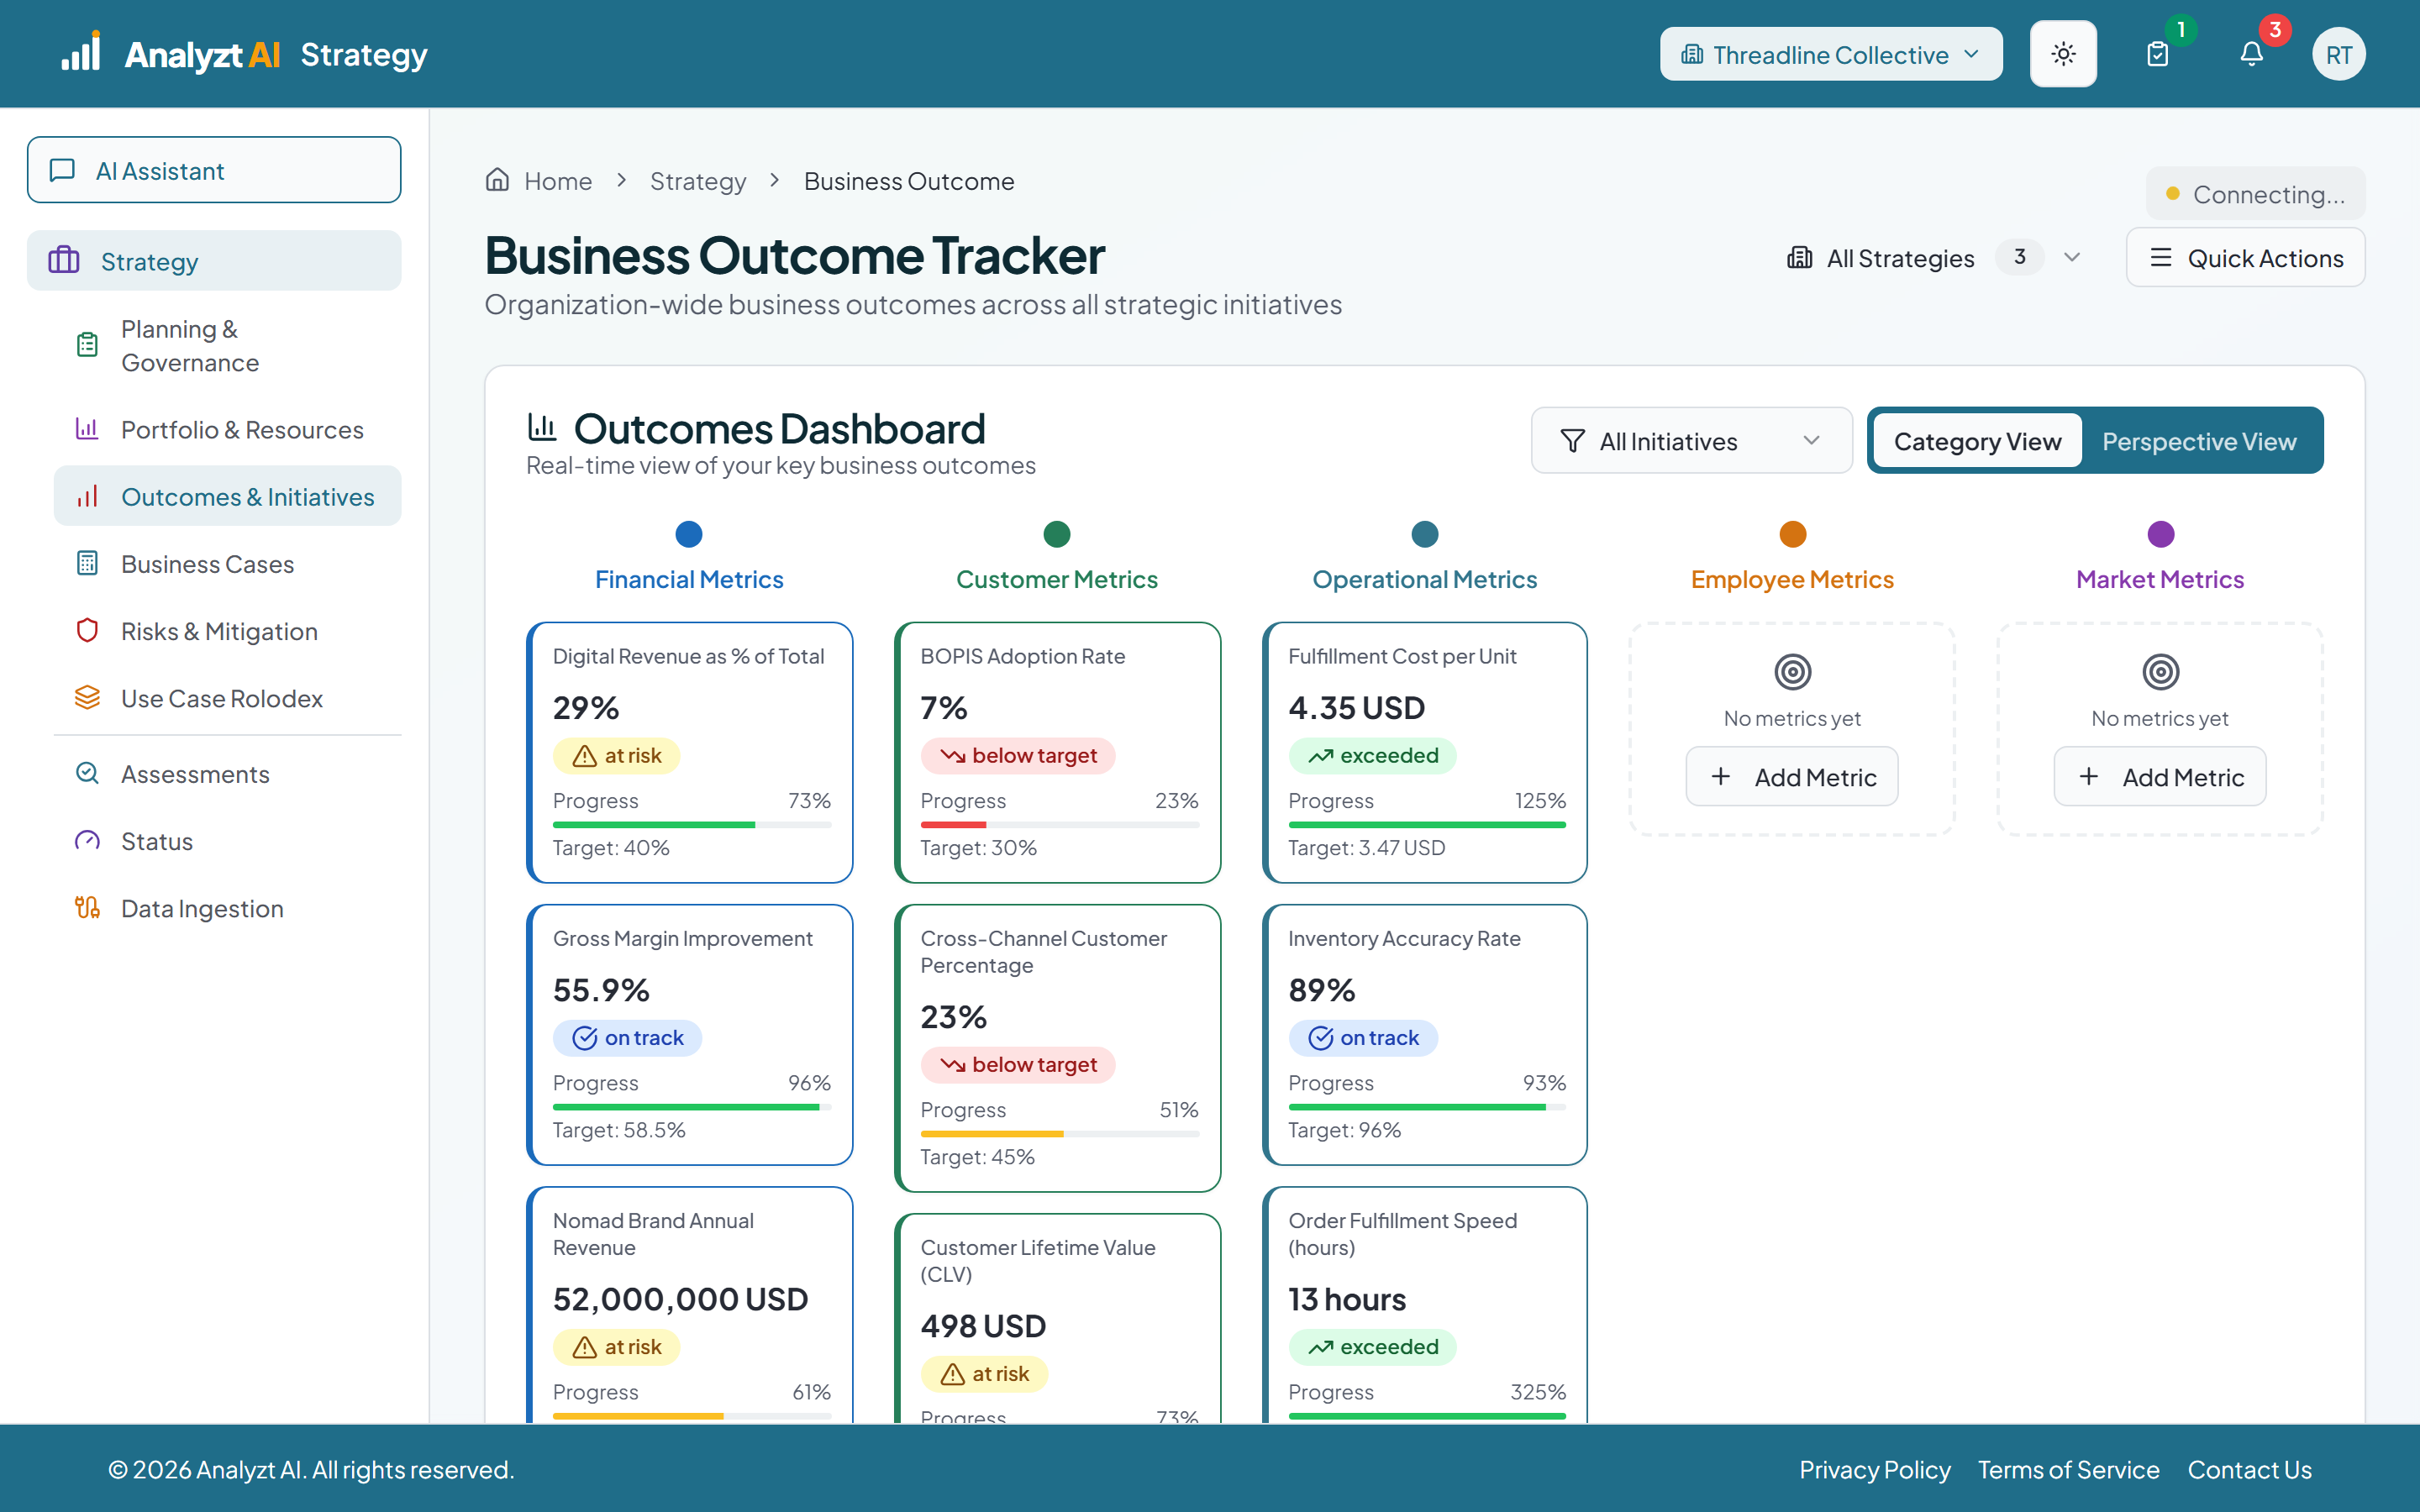
Where Everything Stands
The status report nobody had to write. Delivery confidence, wins and issues, a computed RAID log, and benefits against what was promised.
 ~1 min
Strategy lead
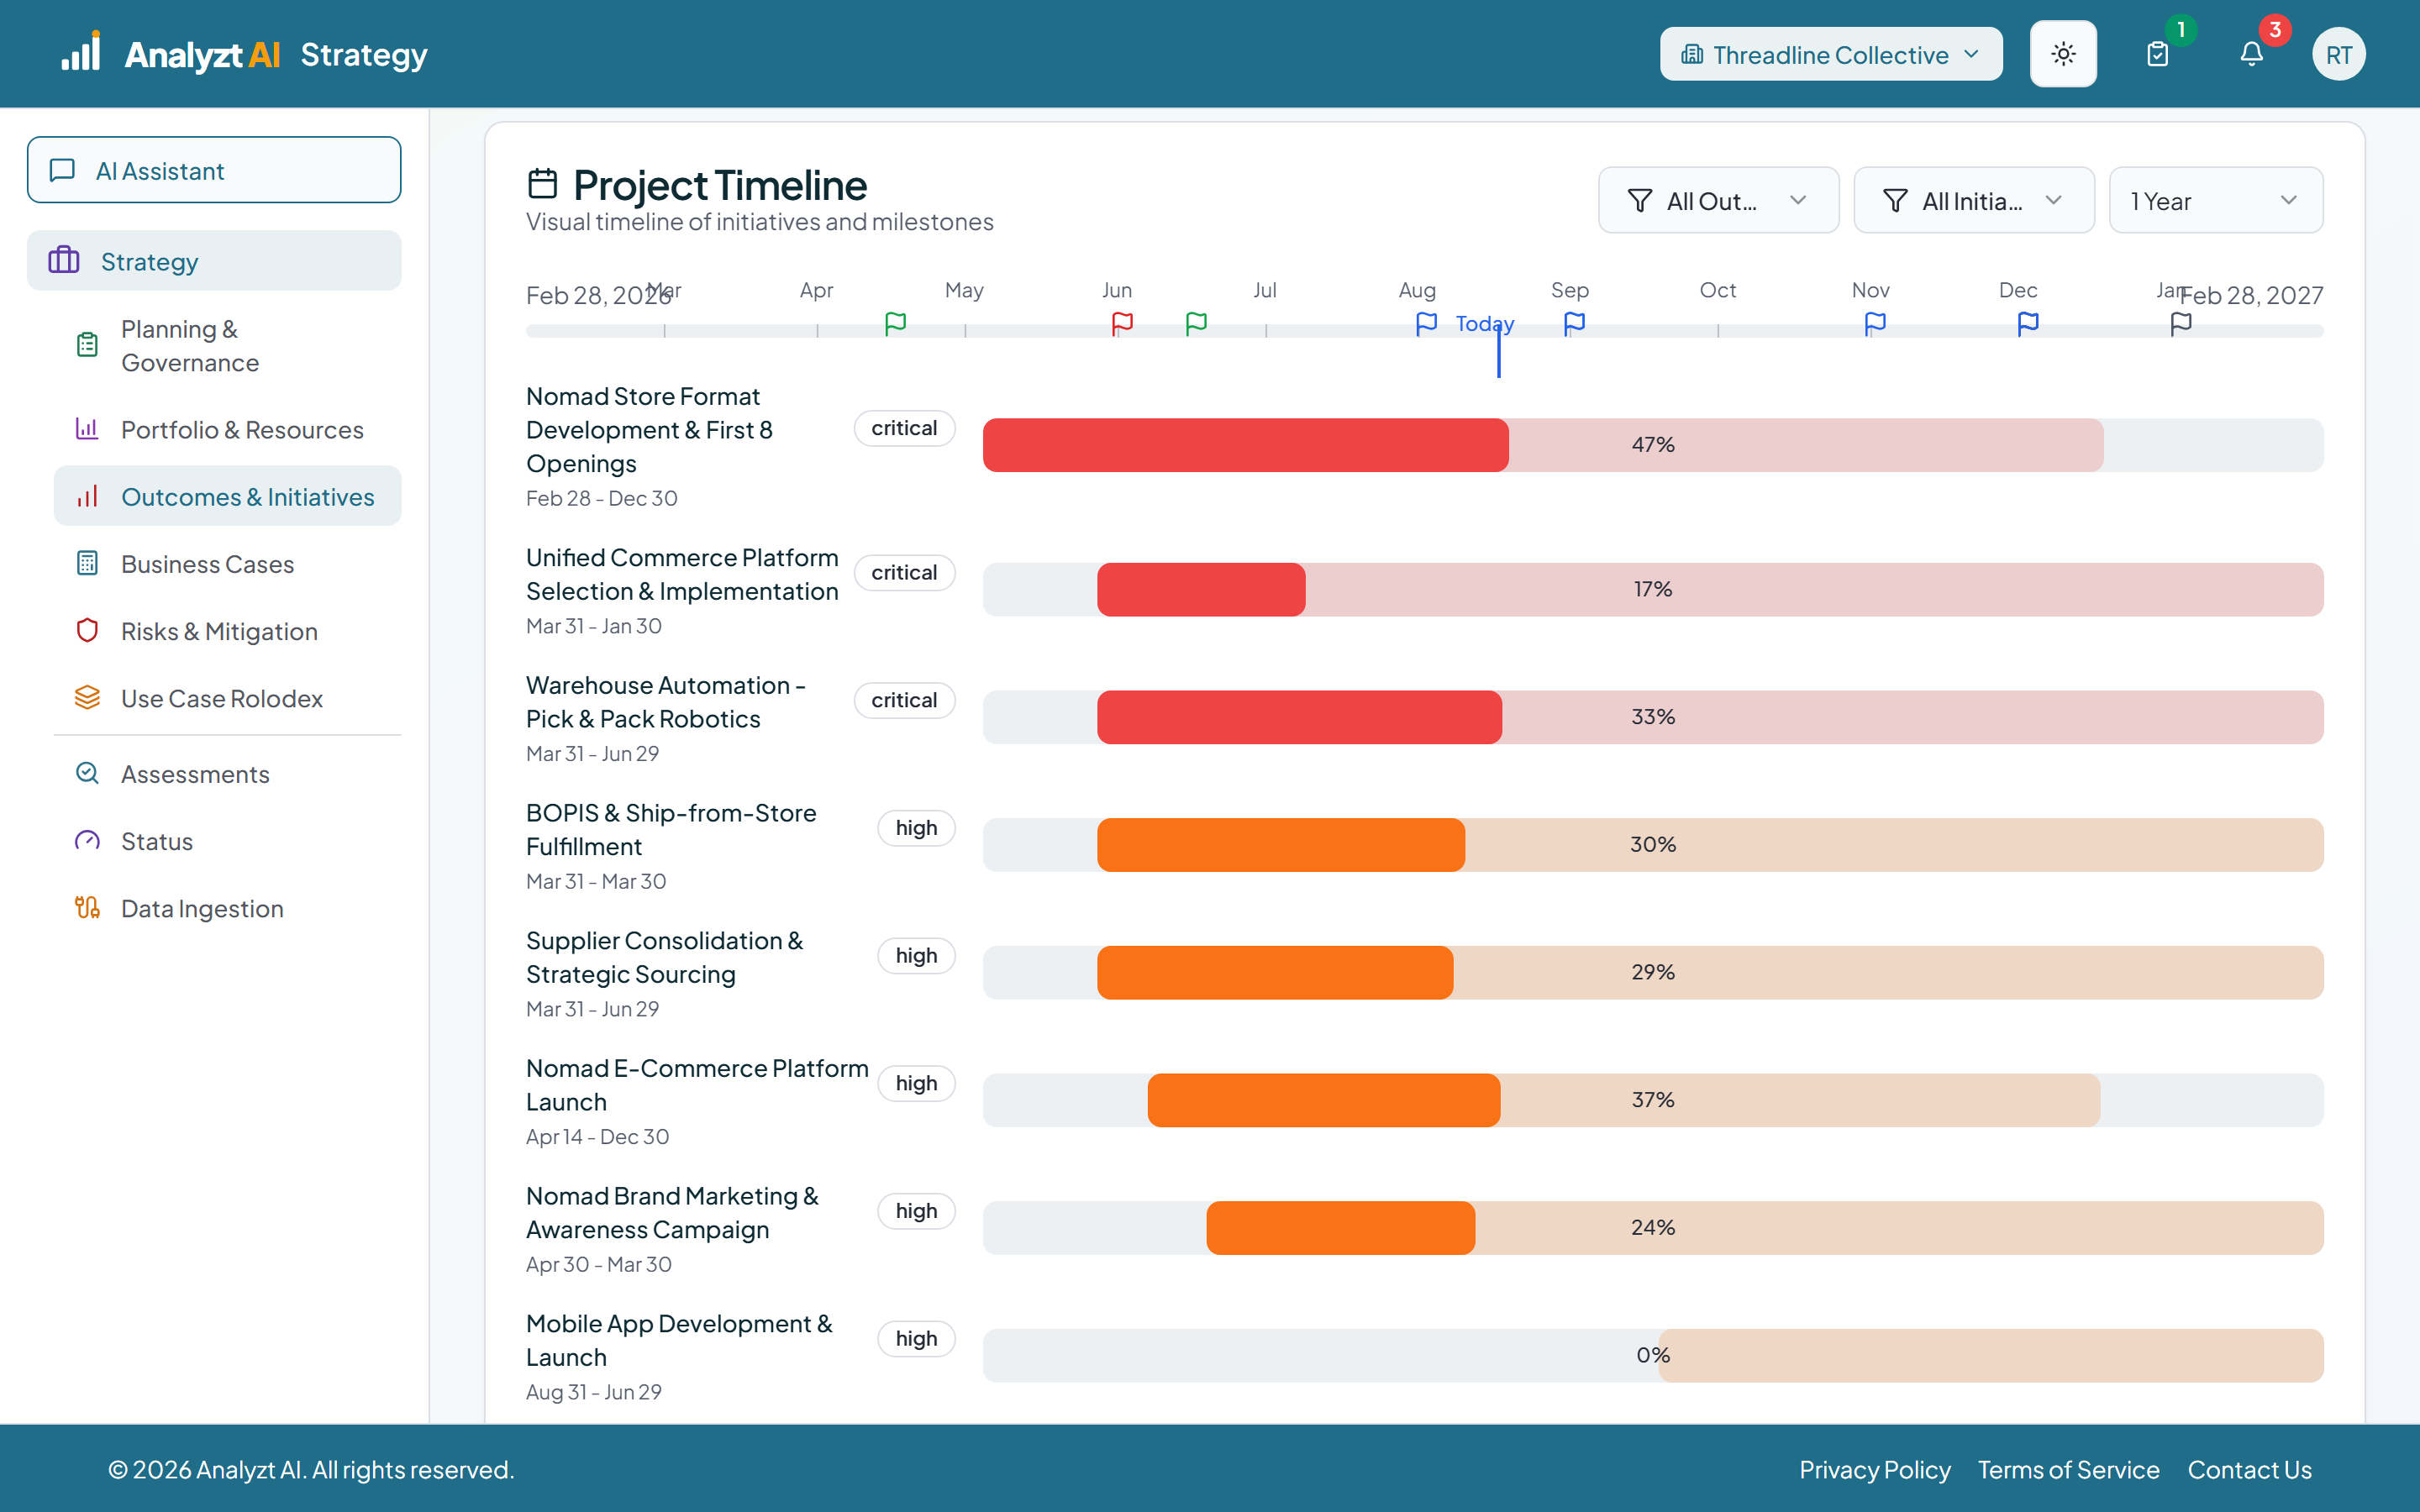
The Milestone Gantt
Initiatives as bars with their priority, dates and progress, milestones flagged on a shared axis against today, and a window and filters that redraw the chart around the work you are asking about.
 ~1 min
Strategy lead · Executive
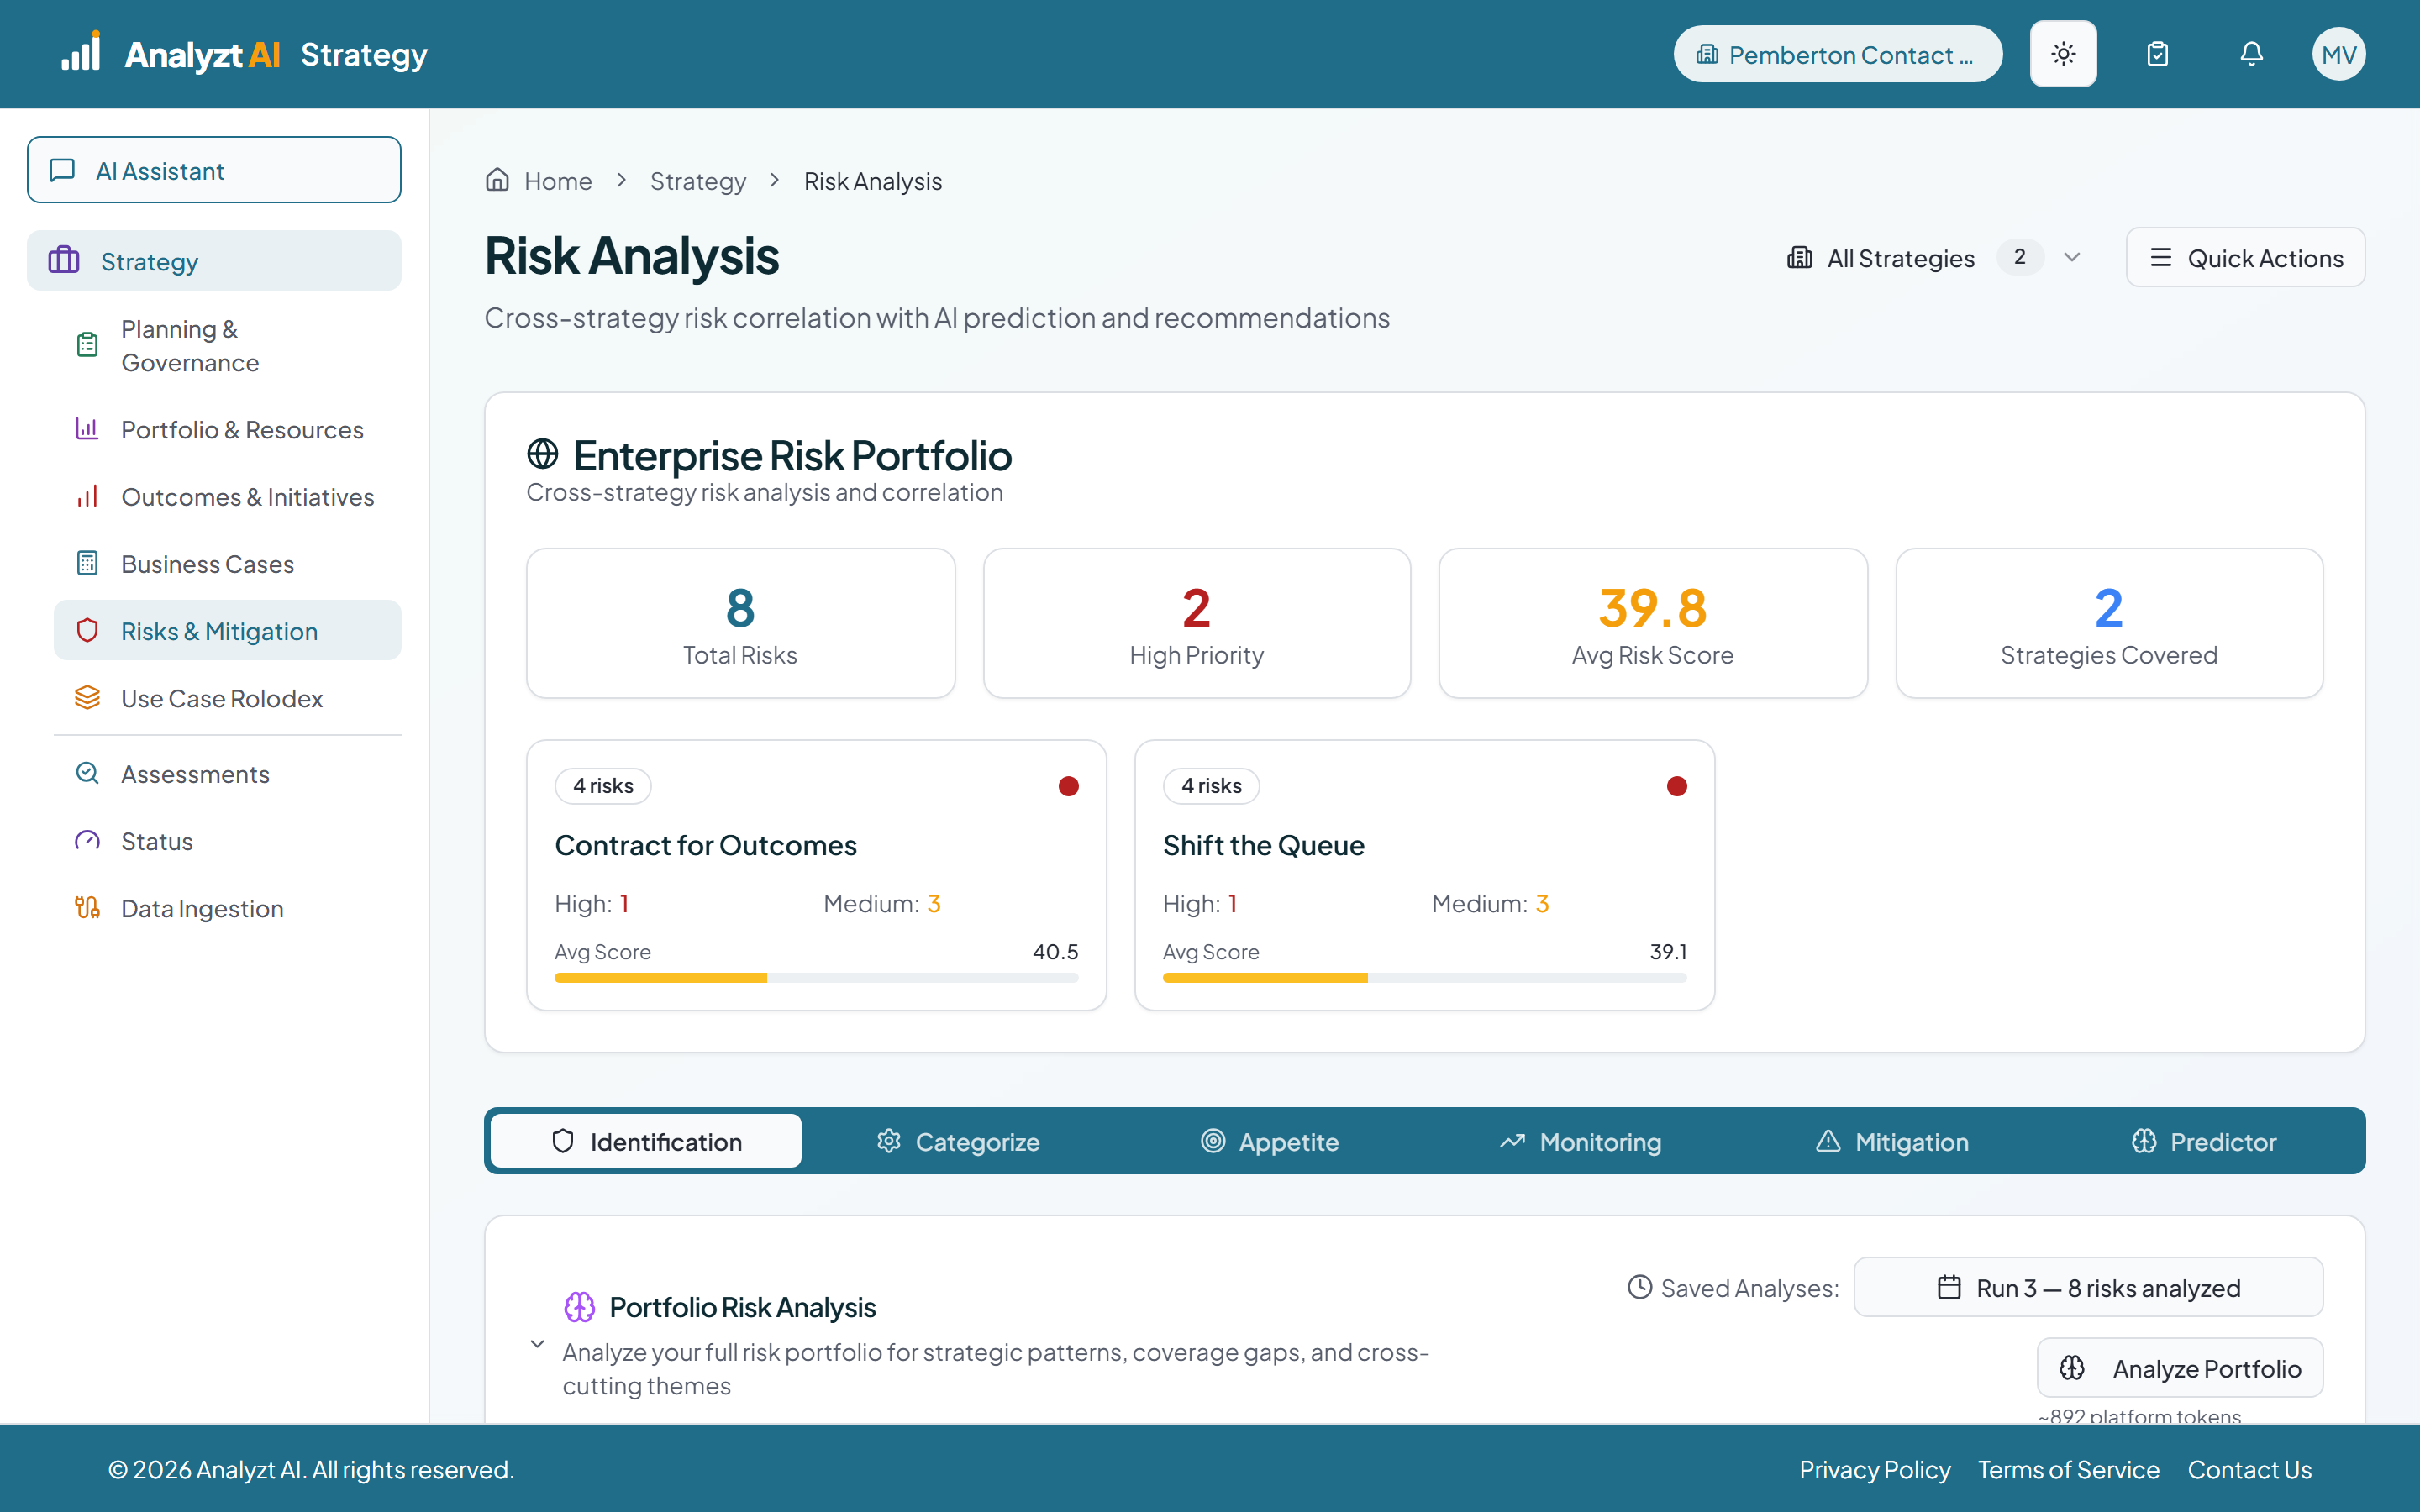
Risk Monitoring in Flight
The register measured against the appetite you set, with capacity pressure, a heat map of what moved, the initiative each risk is tied to, and a saved forecast of where each score is heading.
 ~1 min
Strategy lead
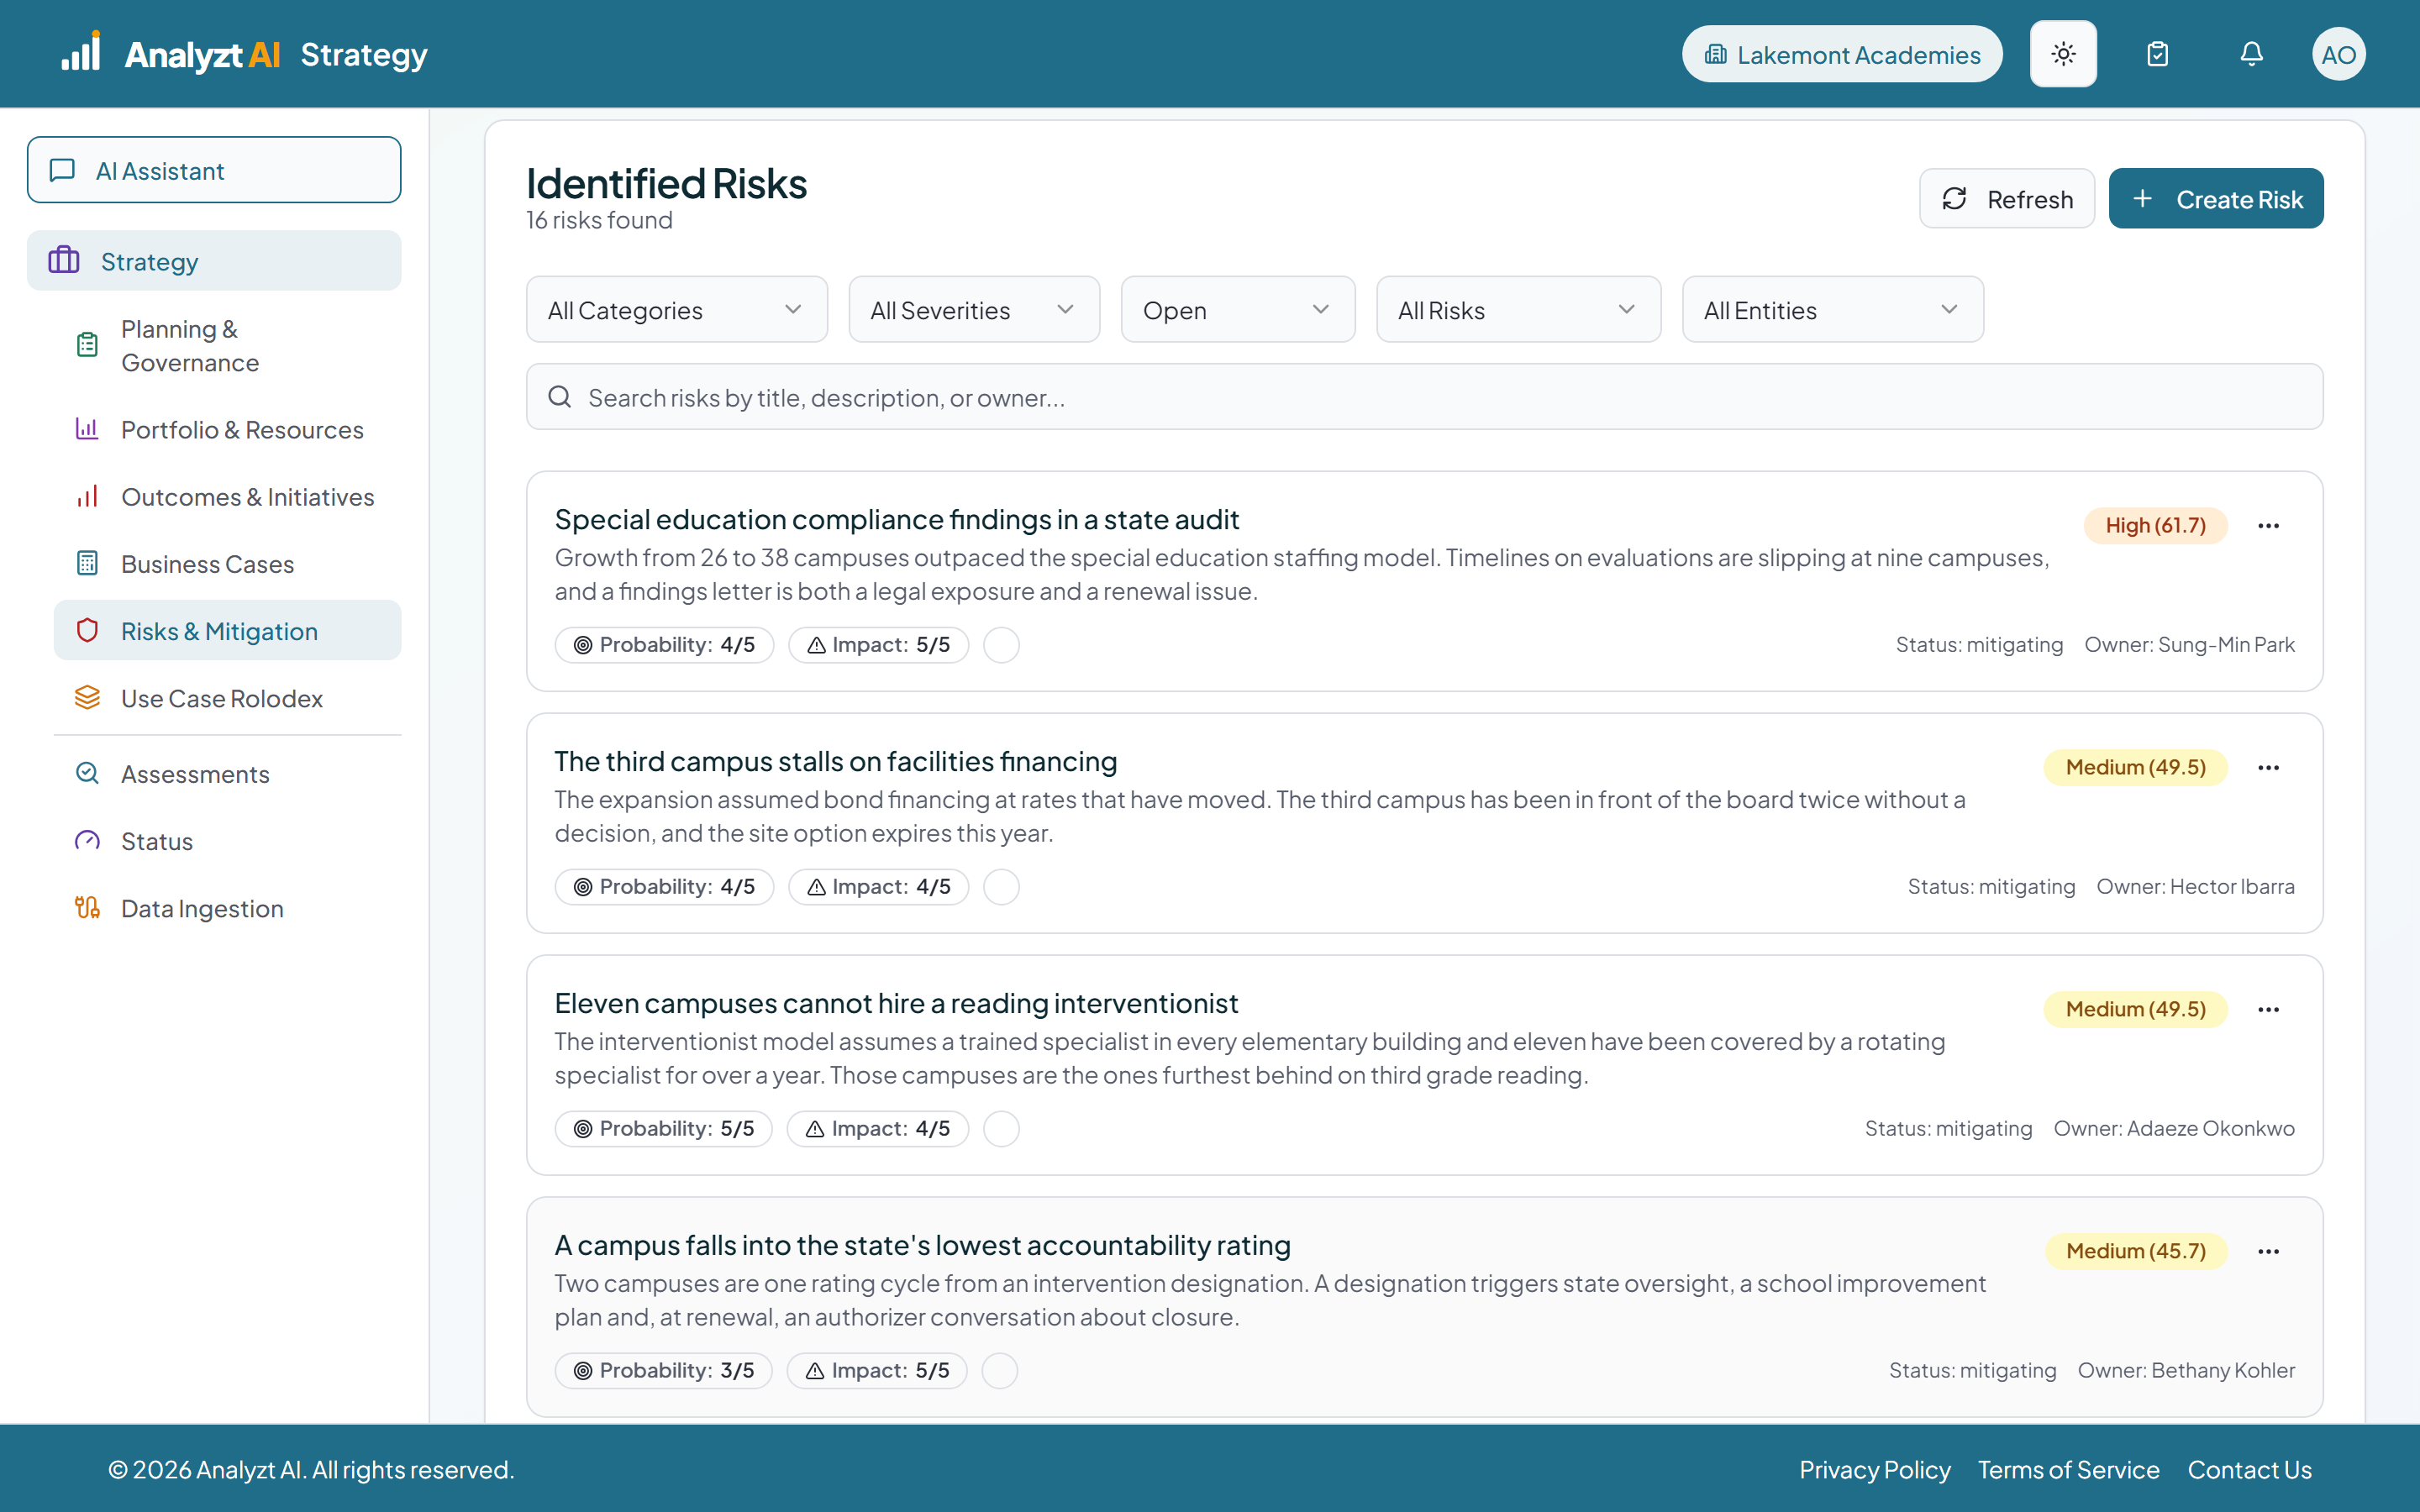
Mitigating a Risk End to End
One risk followed the whole way. Recorded against the work it threatens, categorized, measured against appetite, mitigated with an owner, then monitored to see whether the mitigation moved it.
 ~1 min
Executive · Strategy lead
Is It Working?
Everyone tracks what they spent. Almost nobody checks what they got. Promised against delivered, with the initiatives and milestones underneath.
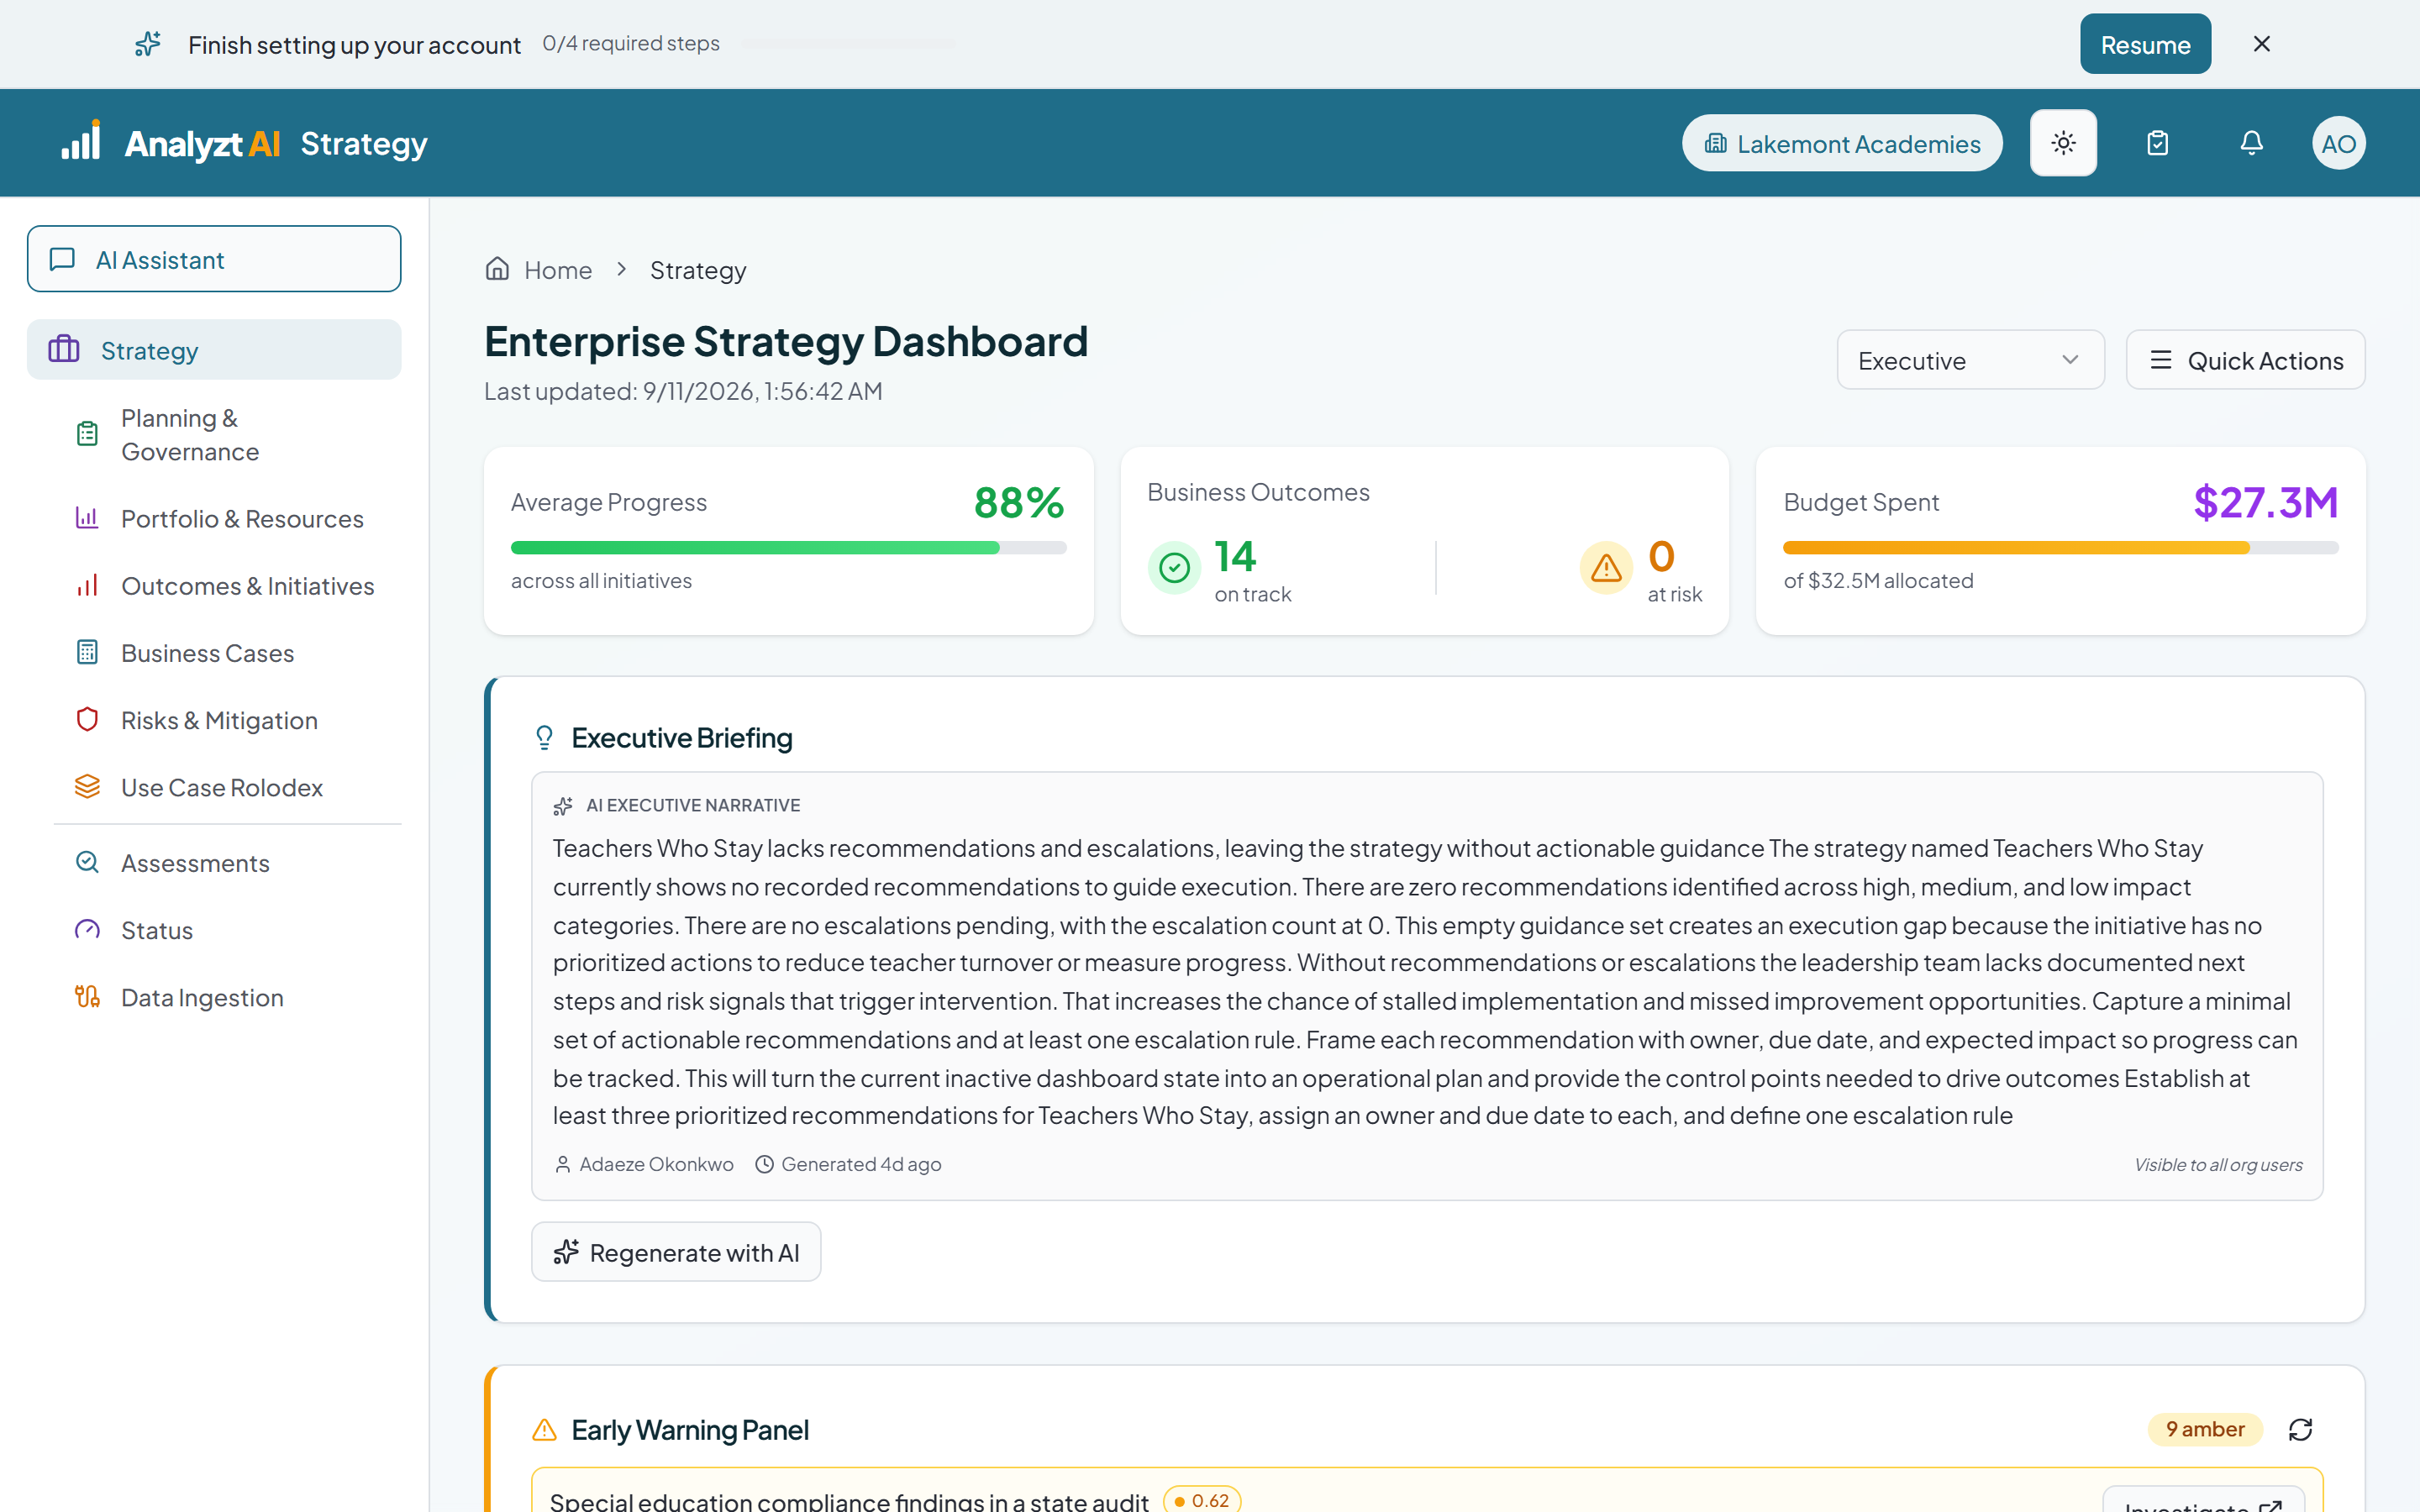 ~2 min
Executive · Finance
Benefits Against Promised
Delivered value compared with what the business case promised, plus a structural check on whether the chain from objective to outcome to initiative is still intact.
Platform
Platform covers what sits under all four phases. The assistant answers from your own portfolio data on any page and can make changes you approve before they are written. Firm administration runs multiple client organizations from one login, and roles control who can see and change what.
3 demos
about 3 min
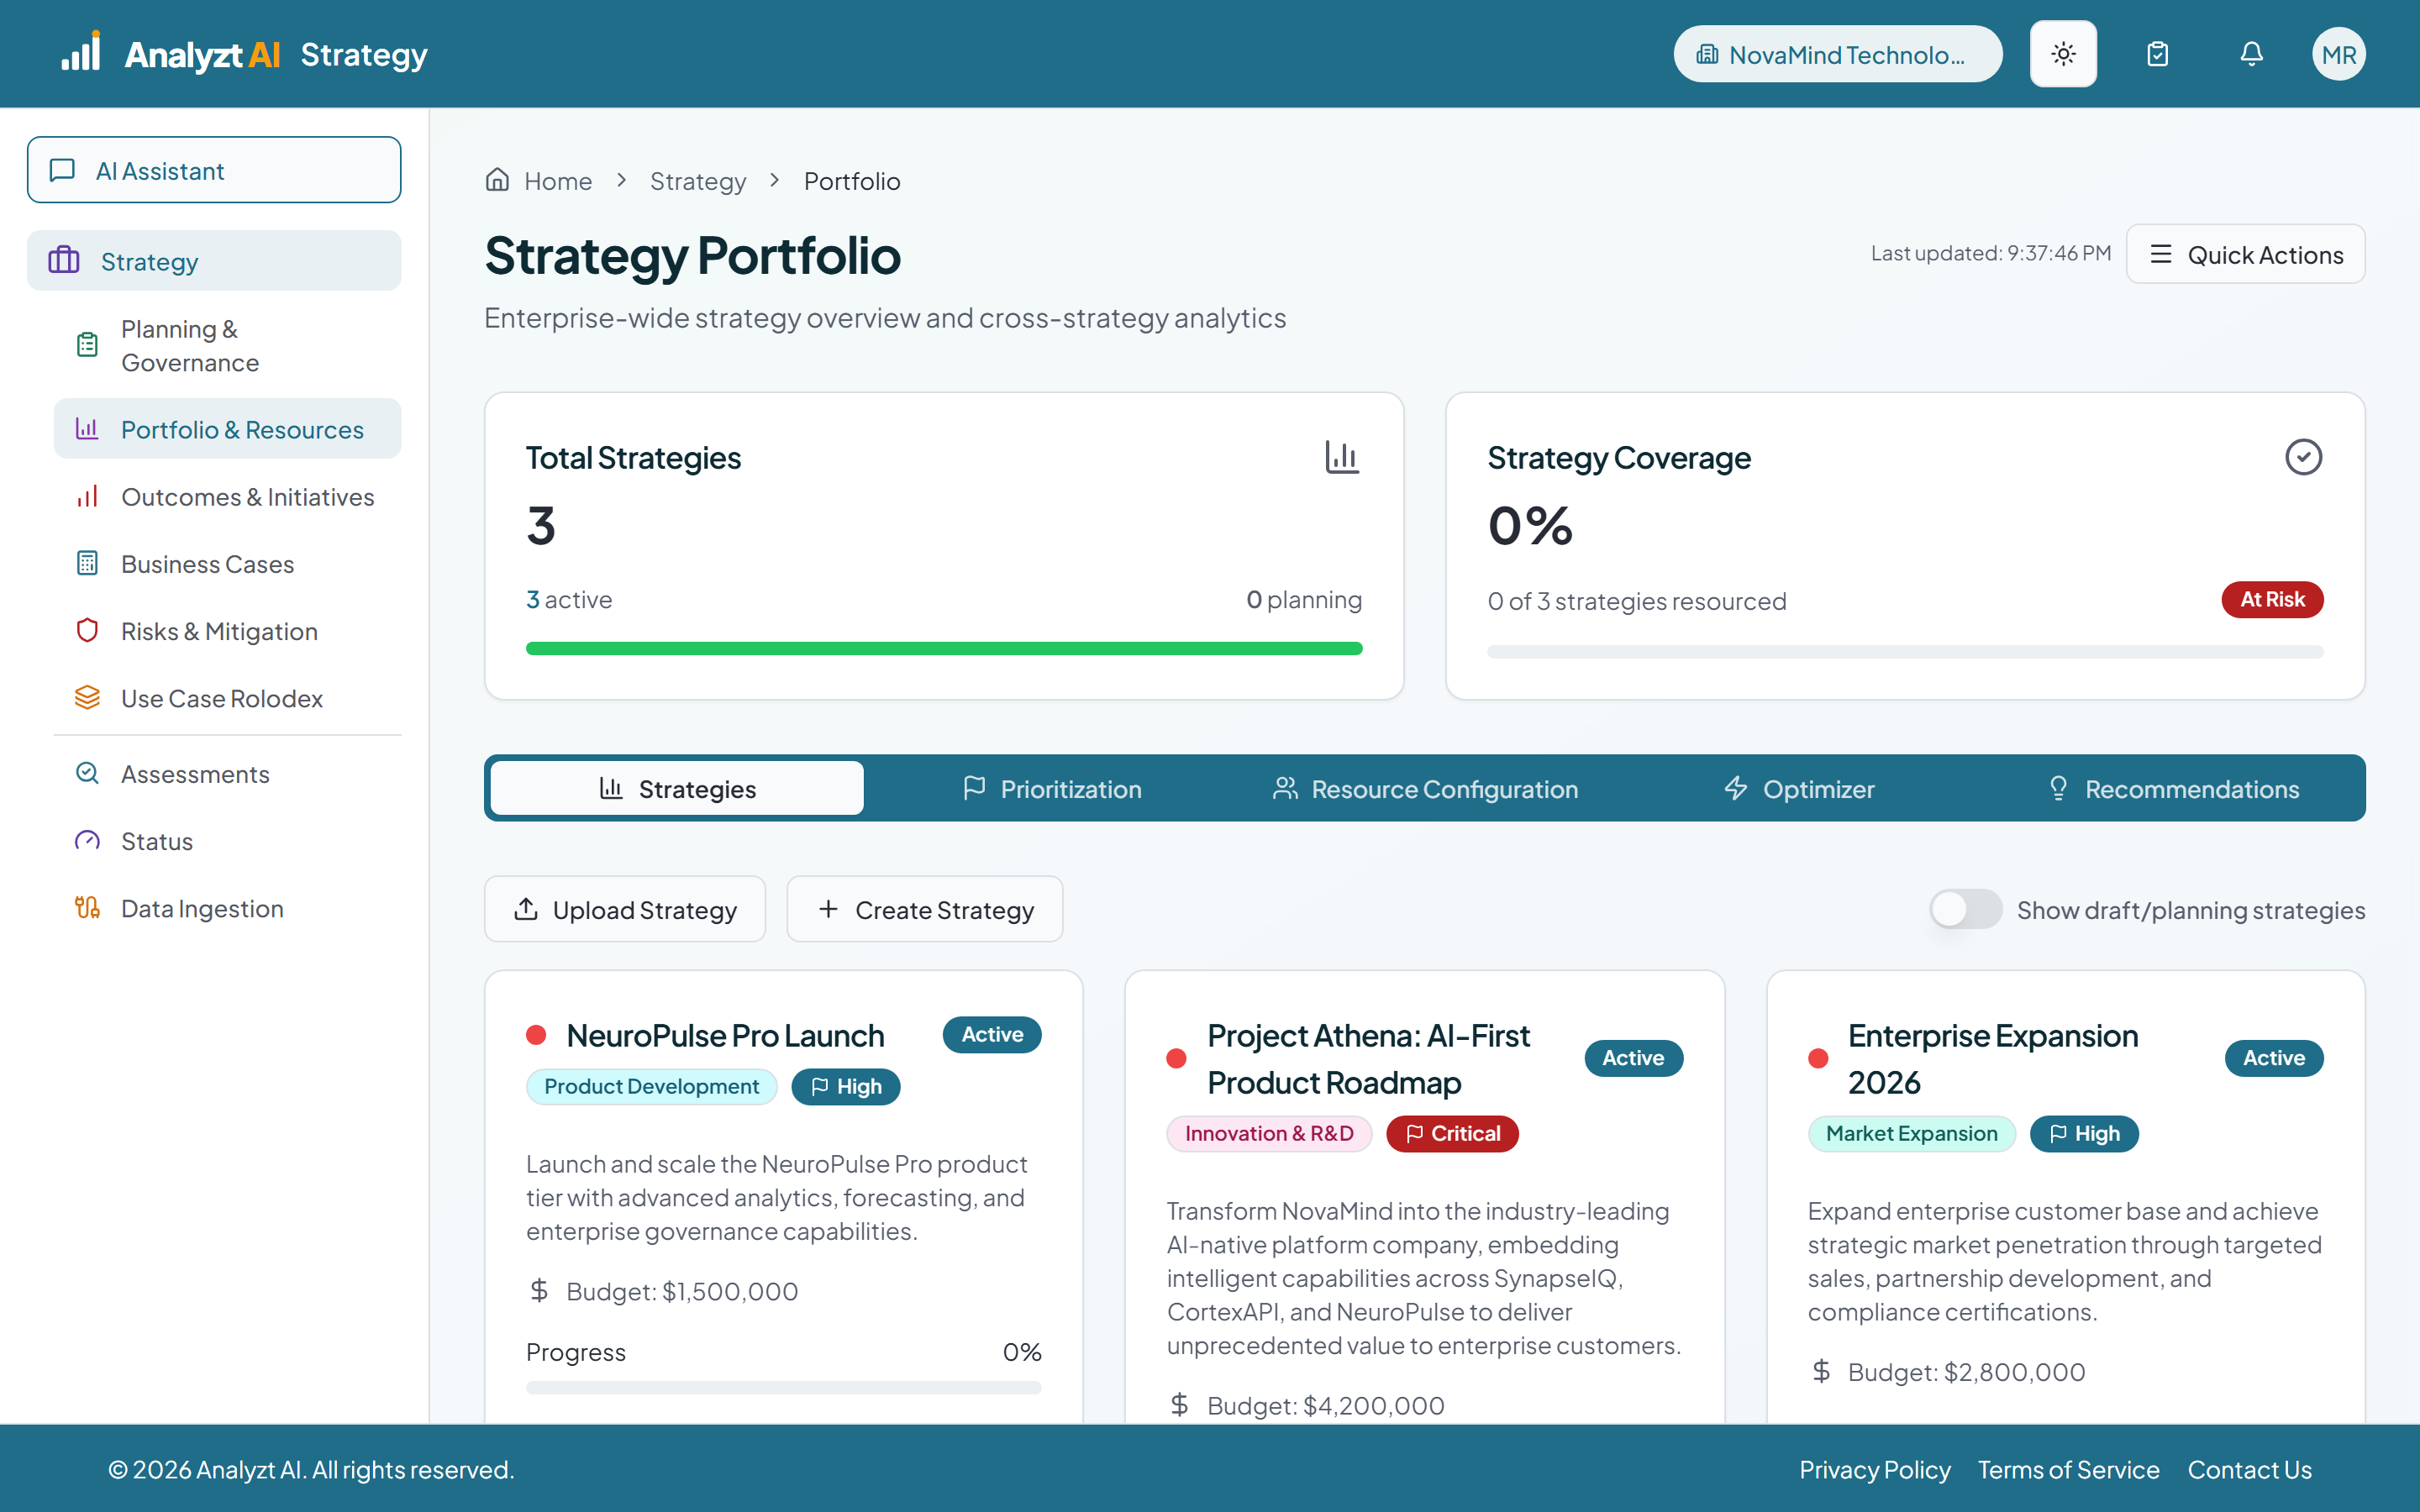 ~1 min
Strategy lead
The AI Assistant
It sits on every page and answers out of your own portfolio, not the internet. Ask in plain language, then tell it what to change and approve the edit before anything is written.
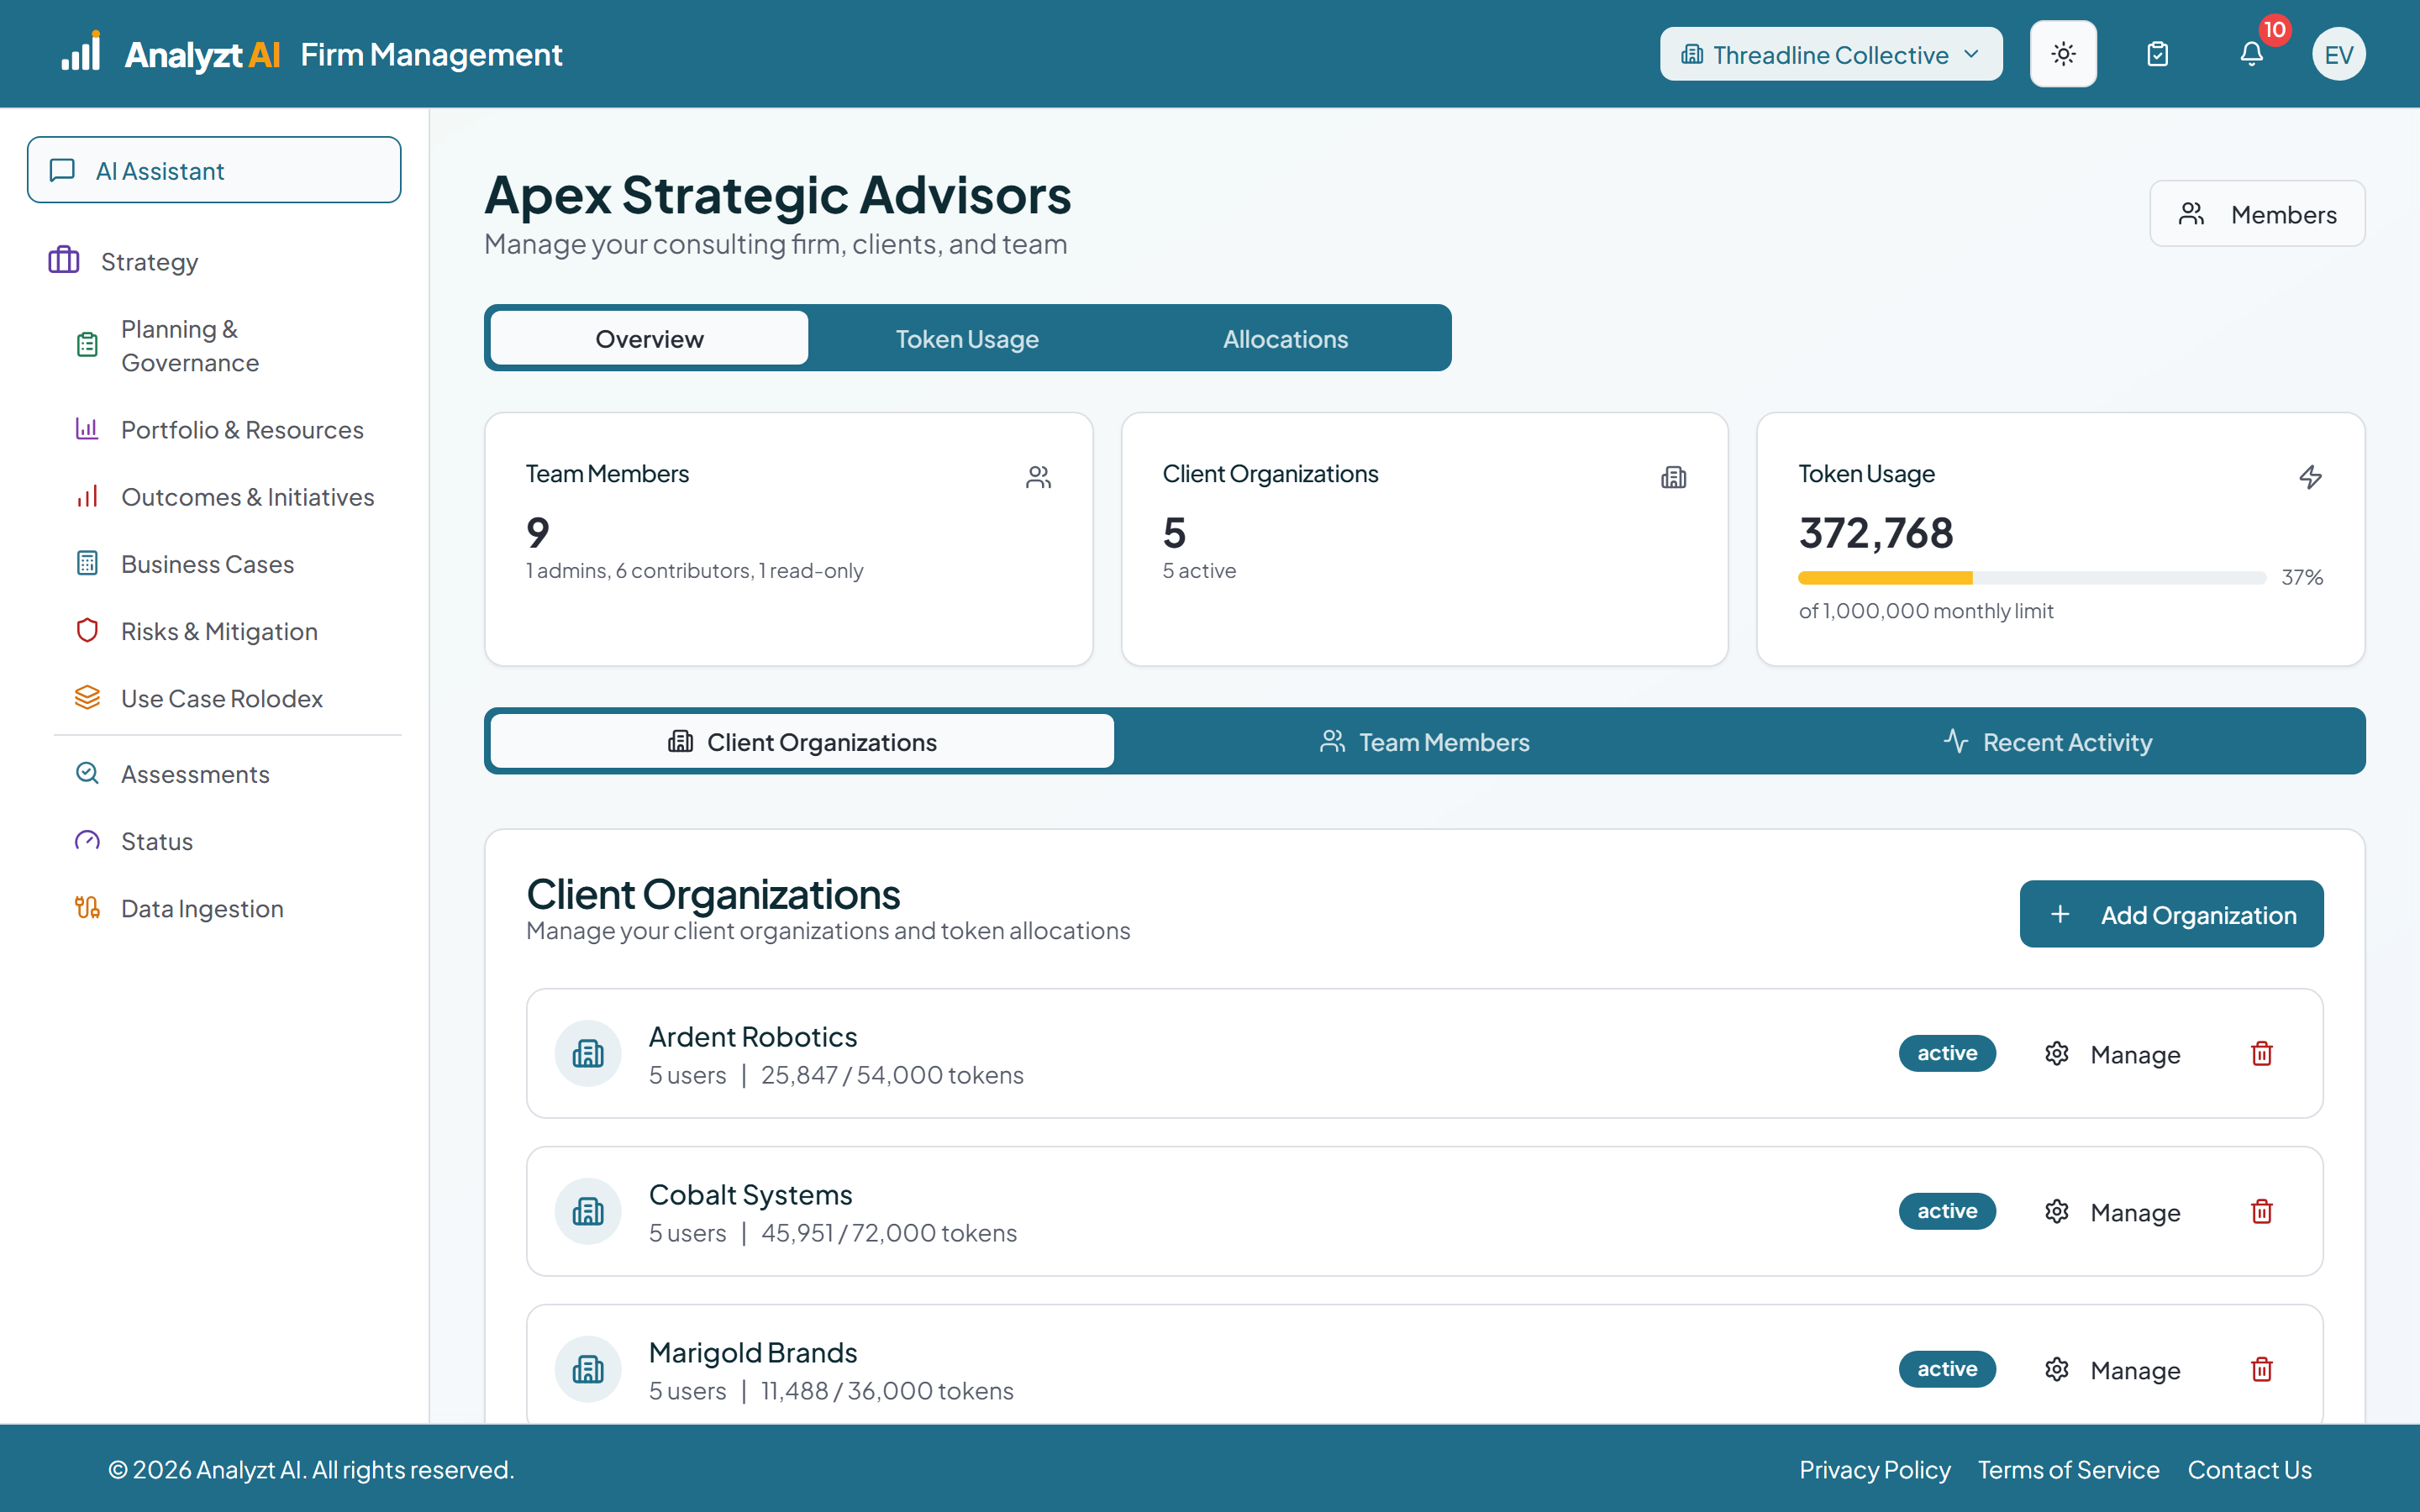 ~1 min
Consulting firm
One Firm, Many Clients
Every client organization from one login, with a single token pool behind them all. Set each client's monthly ceiling by hand, or let auto balance spread it, and see who is running hot before the bill tells you.
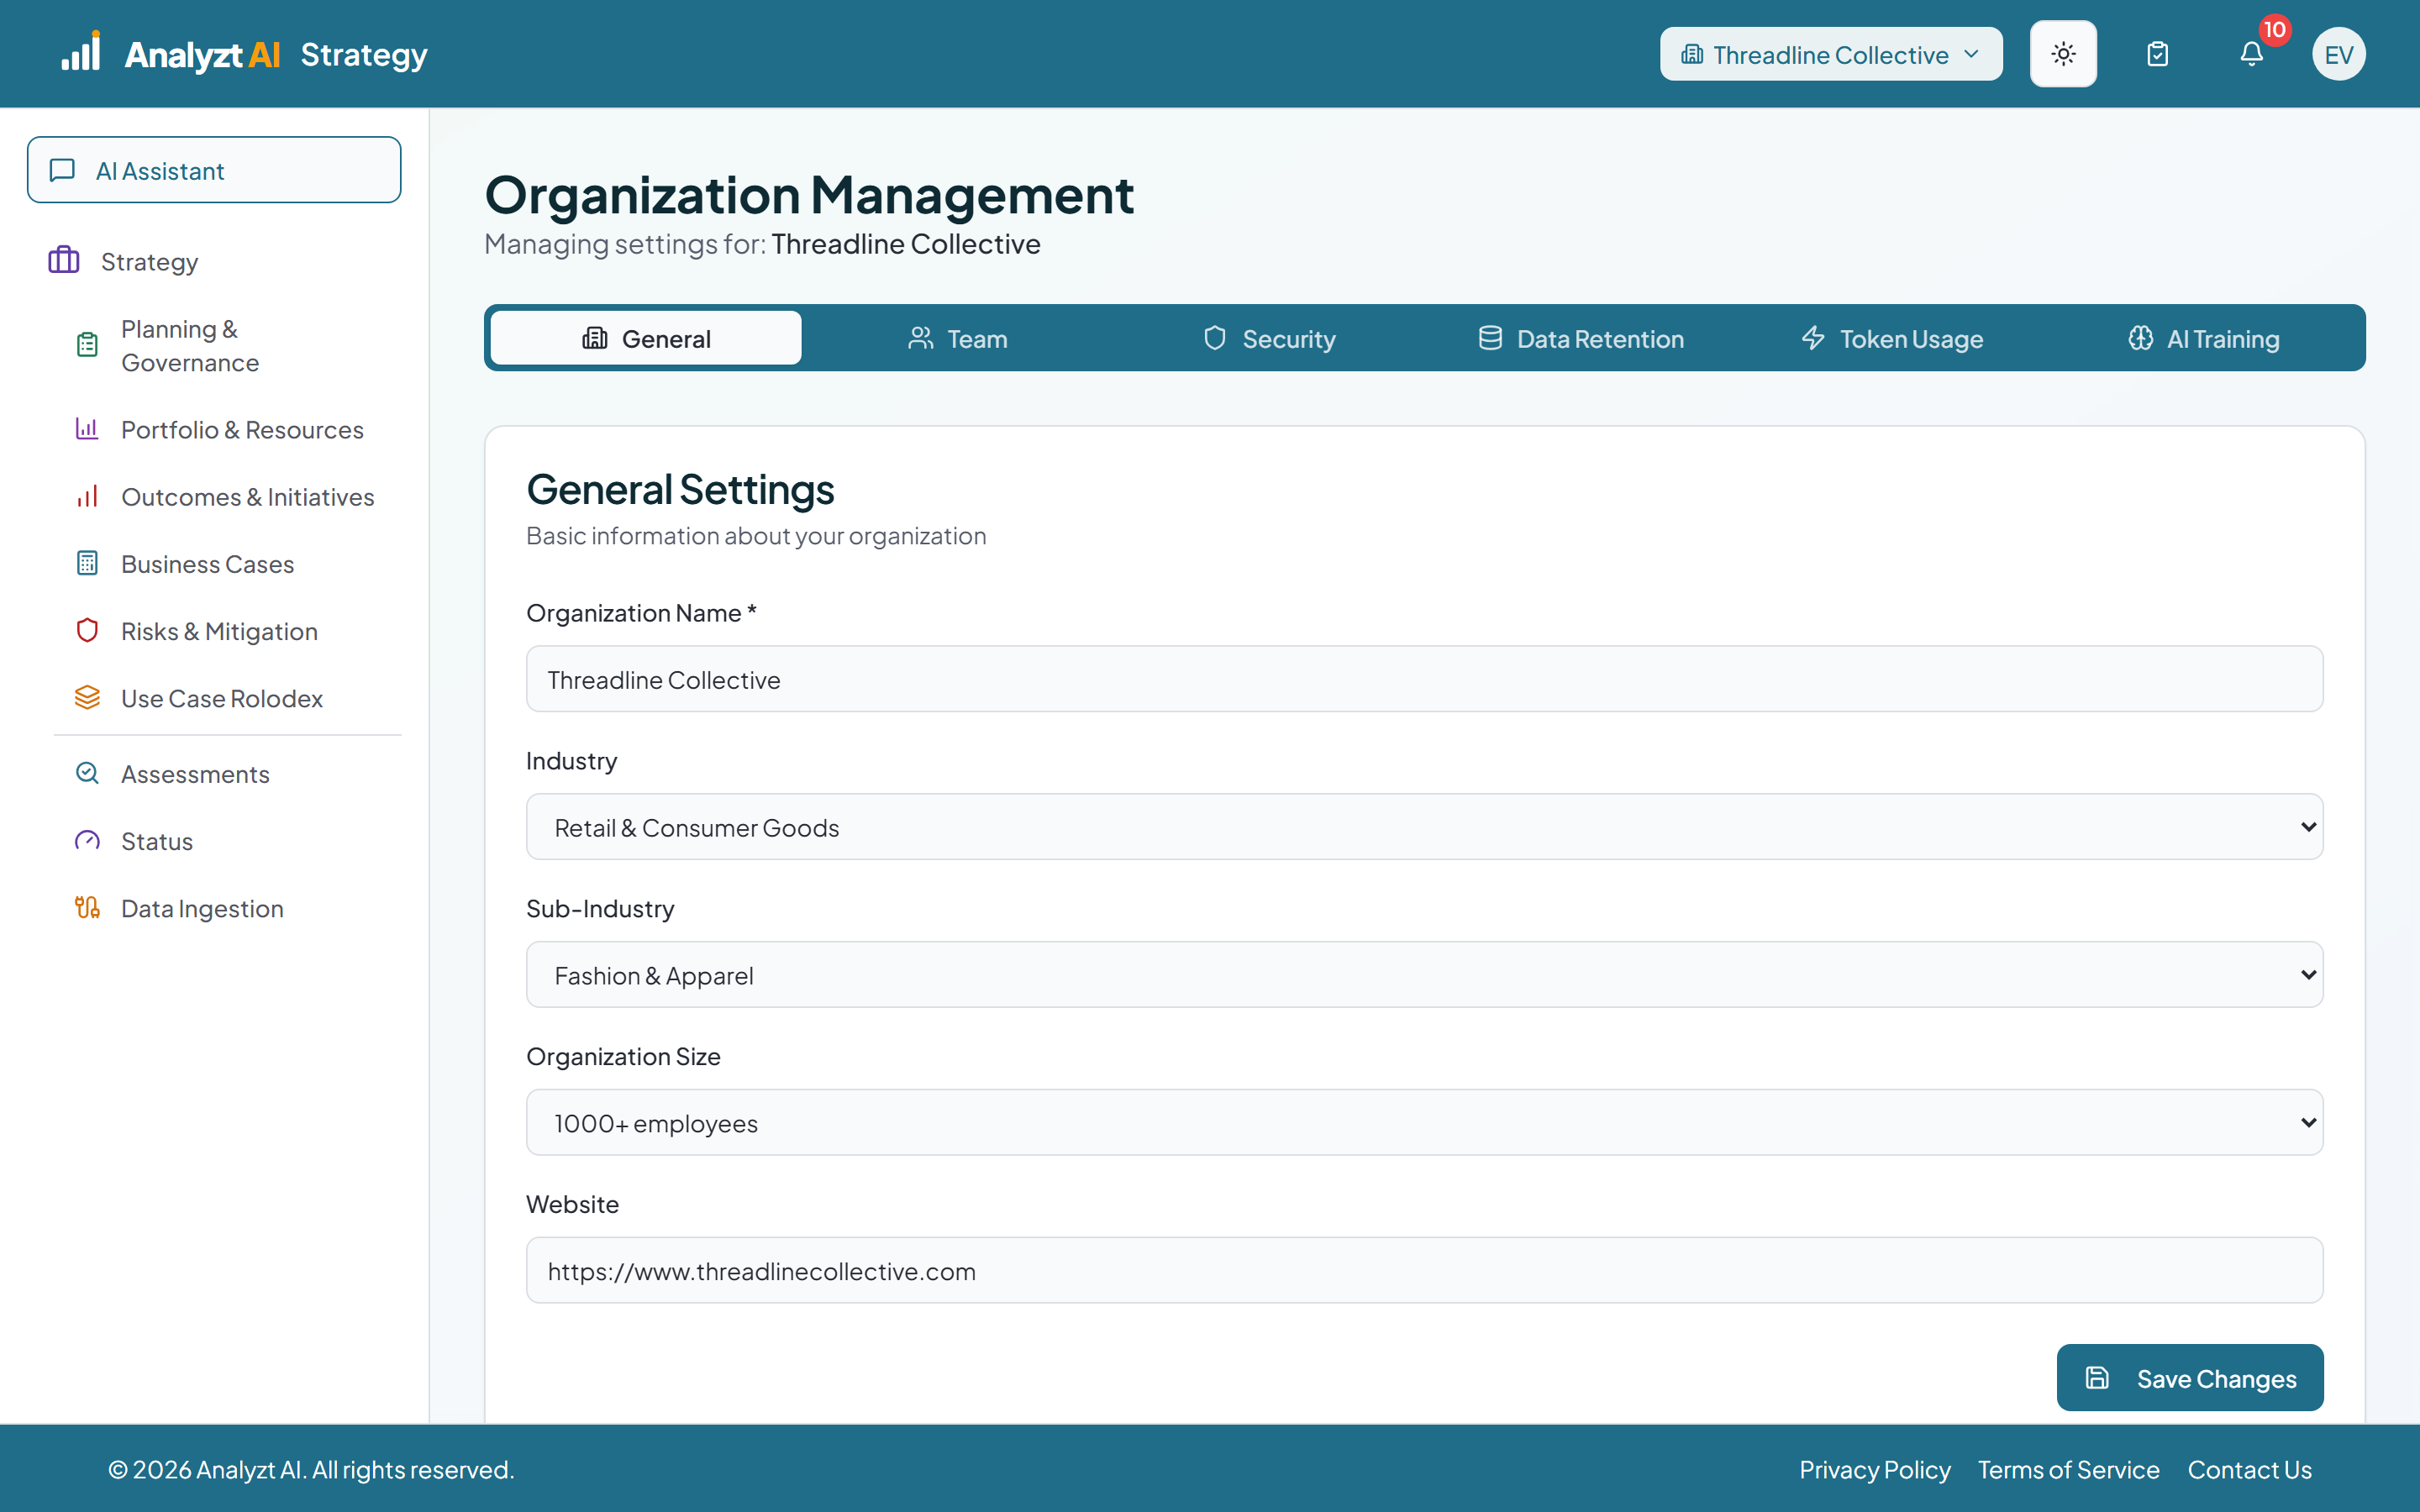 ~1 min
Administrator
Who Can See What
Owner, administrator, contributor and read only, each held by a person rather than inherited from a group. Multi factor authentication, data retention and a token alert threshold sit on the same page.
Seen enough to talk?
Onboarding is hands on and starts with a 20 minute call. Free during beta, Founding Member terms locked in.
Start a conversationPrefer to pick a time now? Book 20 minutes directly. Prefer to write first? Use the contact form.