See where outcomes are heading
Where each outcome is predicted to end up, how confident the platform is in that, and whether the milestones under it will land on time.
Start with How the Scores Are Made- 1
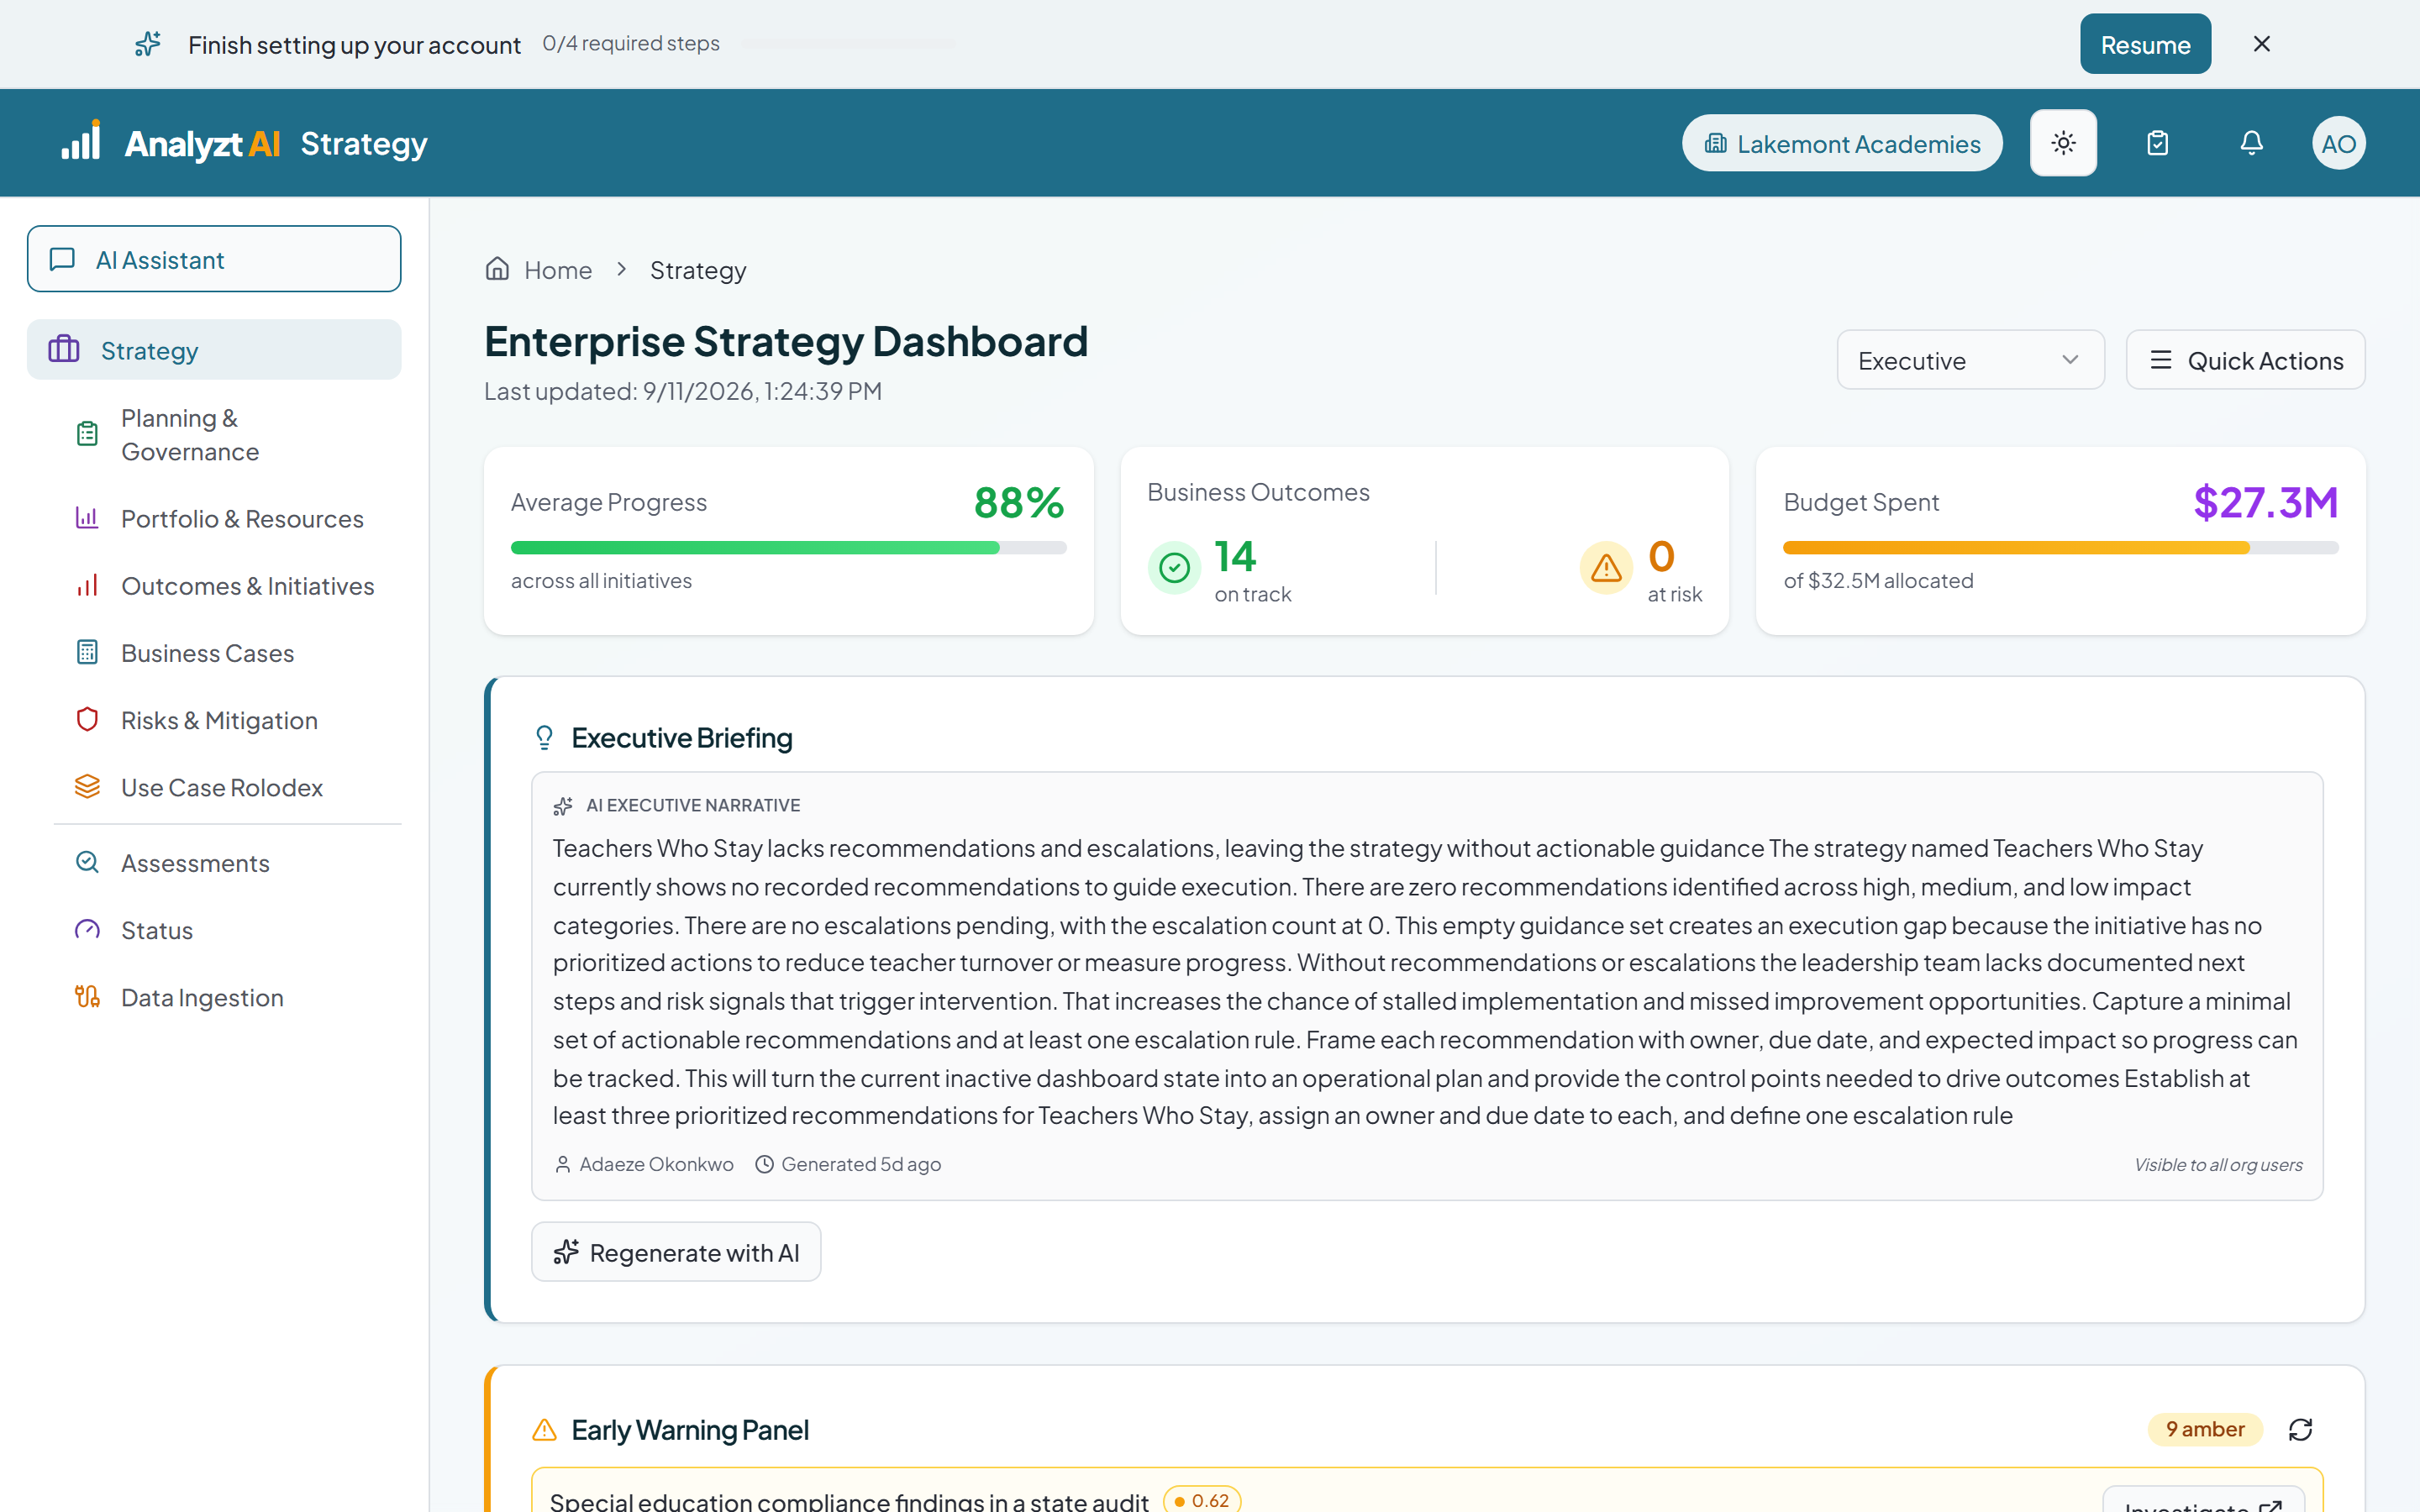
How the Scores Are Made
~1 minSome numbers on the dashboard are calculated from your data and are exact. Others are model predictions and carry a confidence. This shows which is which, and how to tell them apart on screen.
- 2
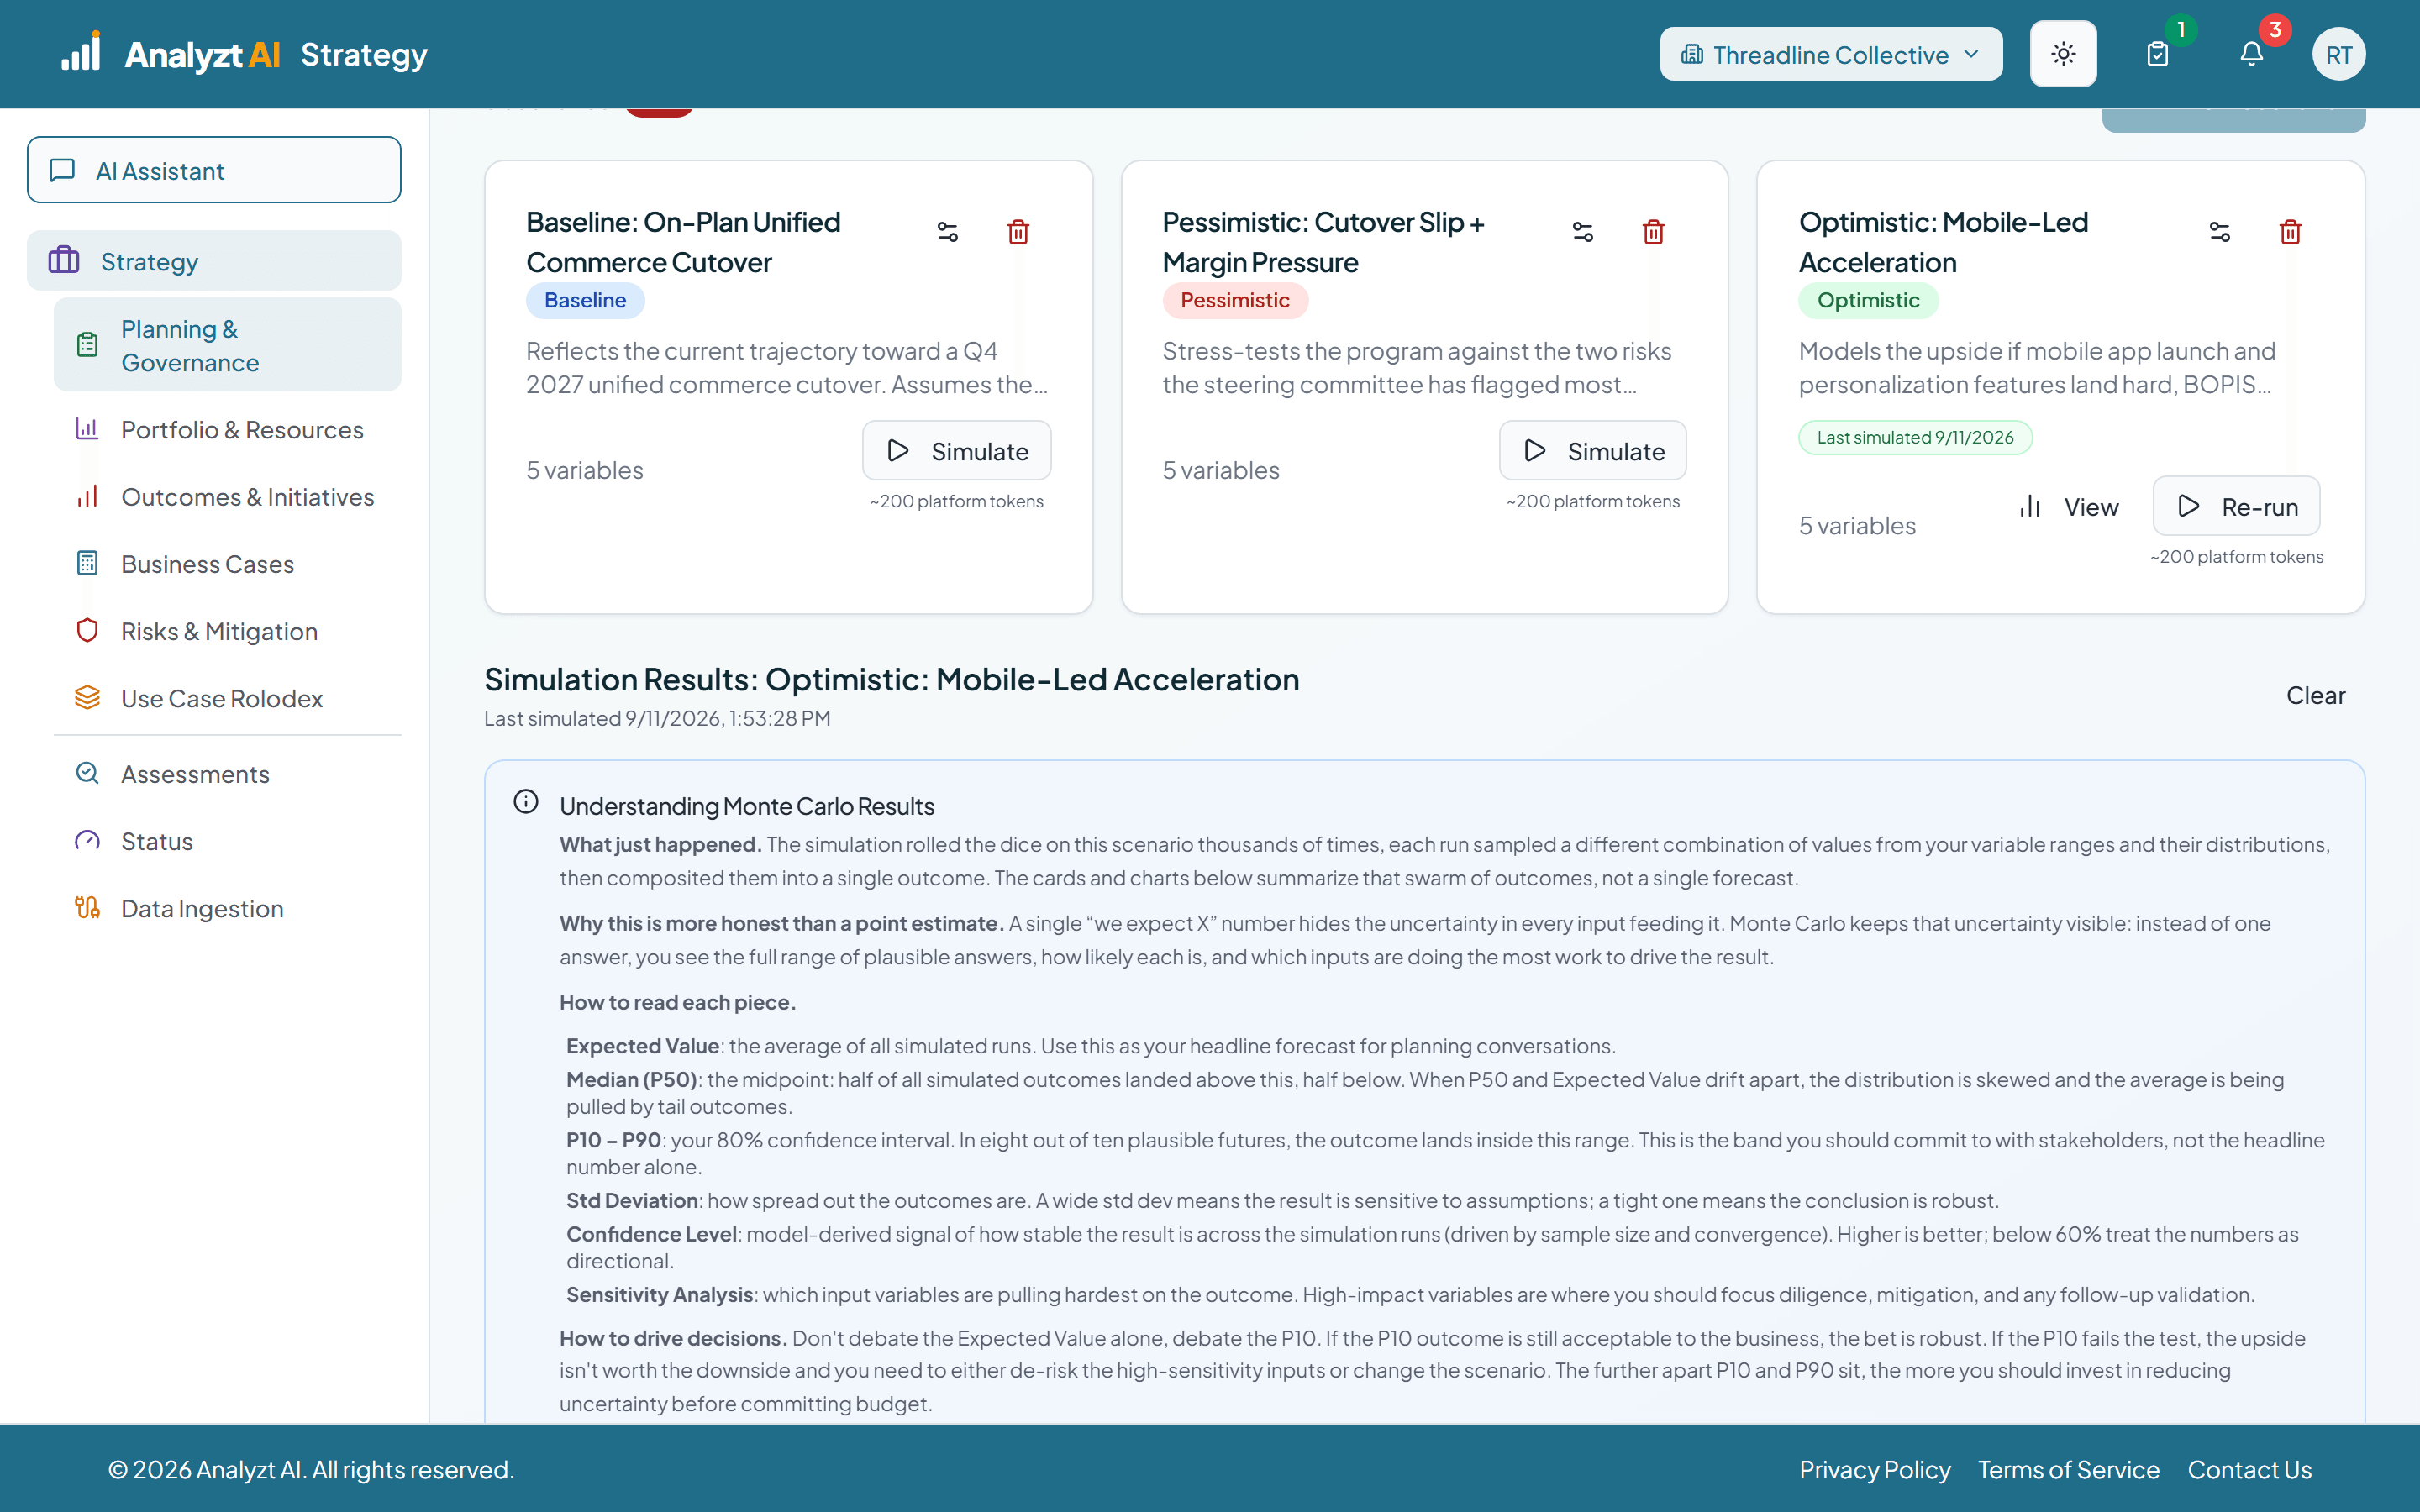
A Range, Not a Number
~3 minMonte Carlo across the whole platform. Planning scenarios, a single business case, the business case portfolio, the risk register and the outcome optimizer, with what each range is telling you and what to do about it.
- 3
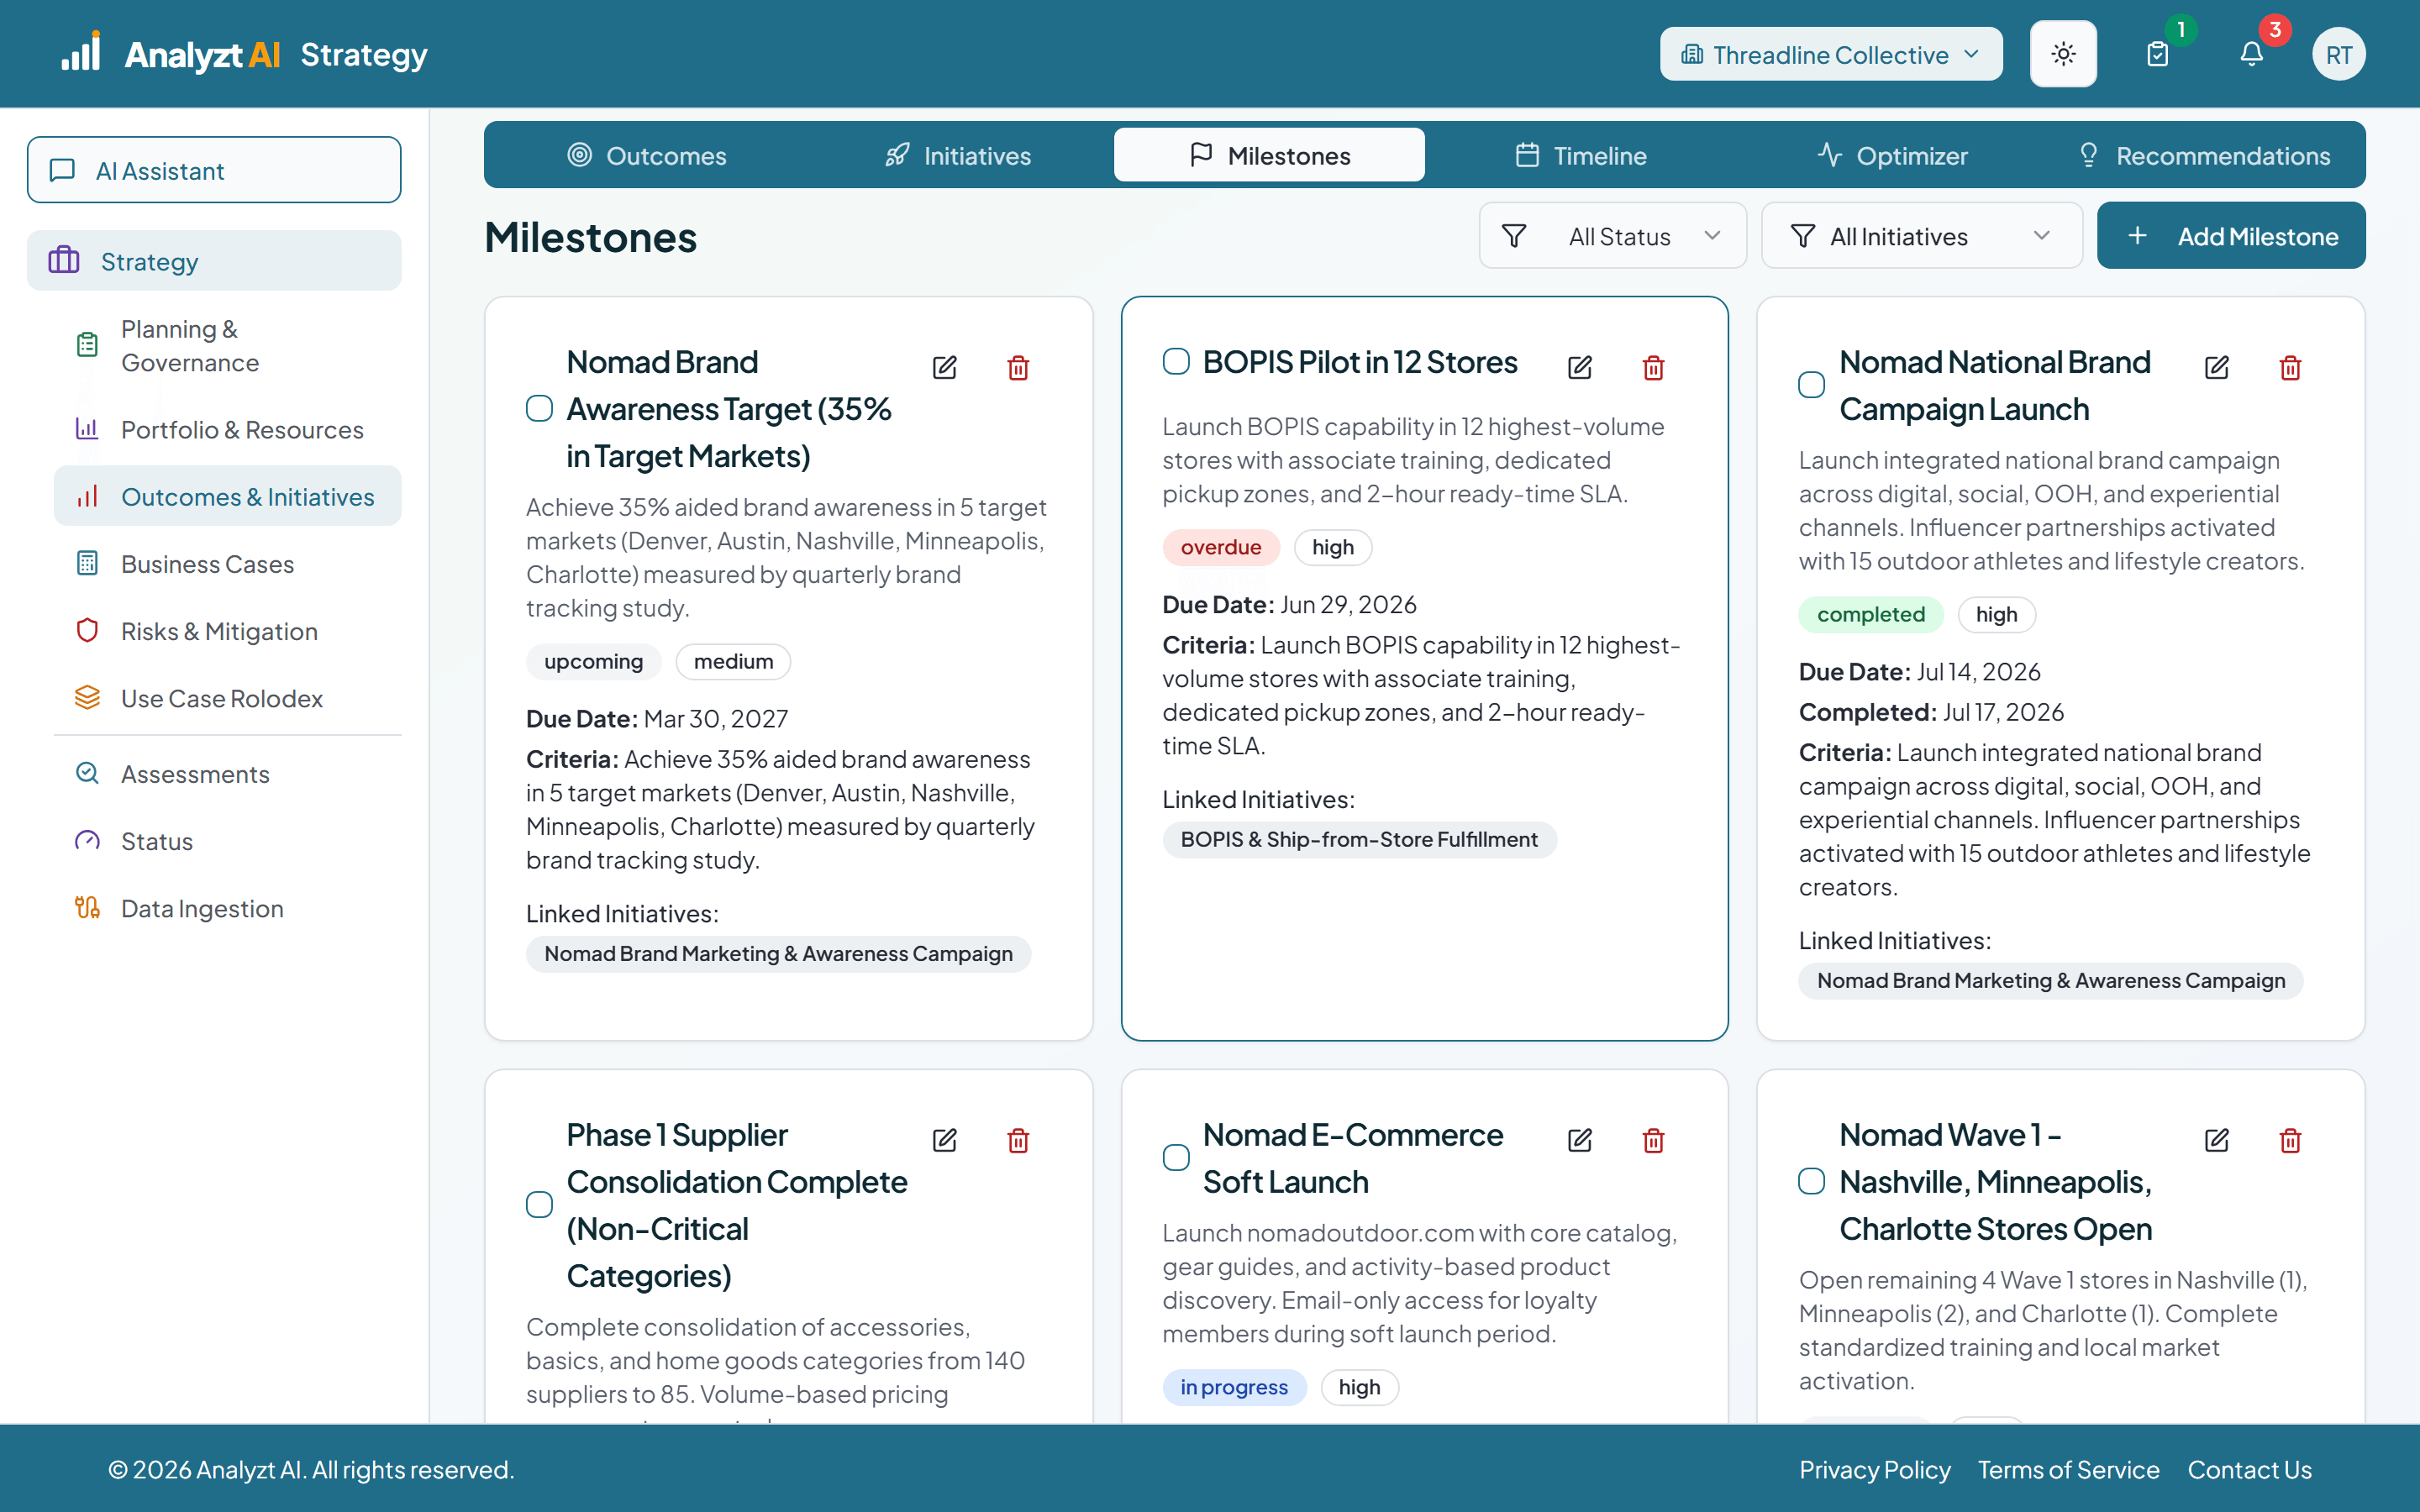
Will It Land On Time
~1 minThe milestone register and the timeline show what was planned and what landed. The optimizer answers whether it will hold, with an on time probability, an outlook that degrades across horizons, and a specific schedule change to consider.
- 4
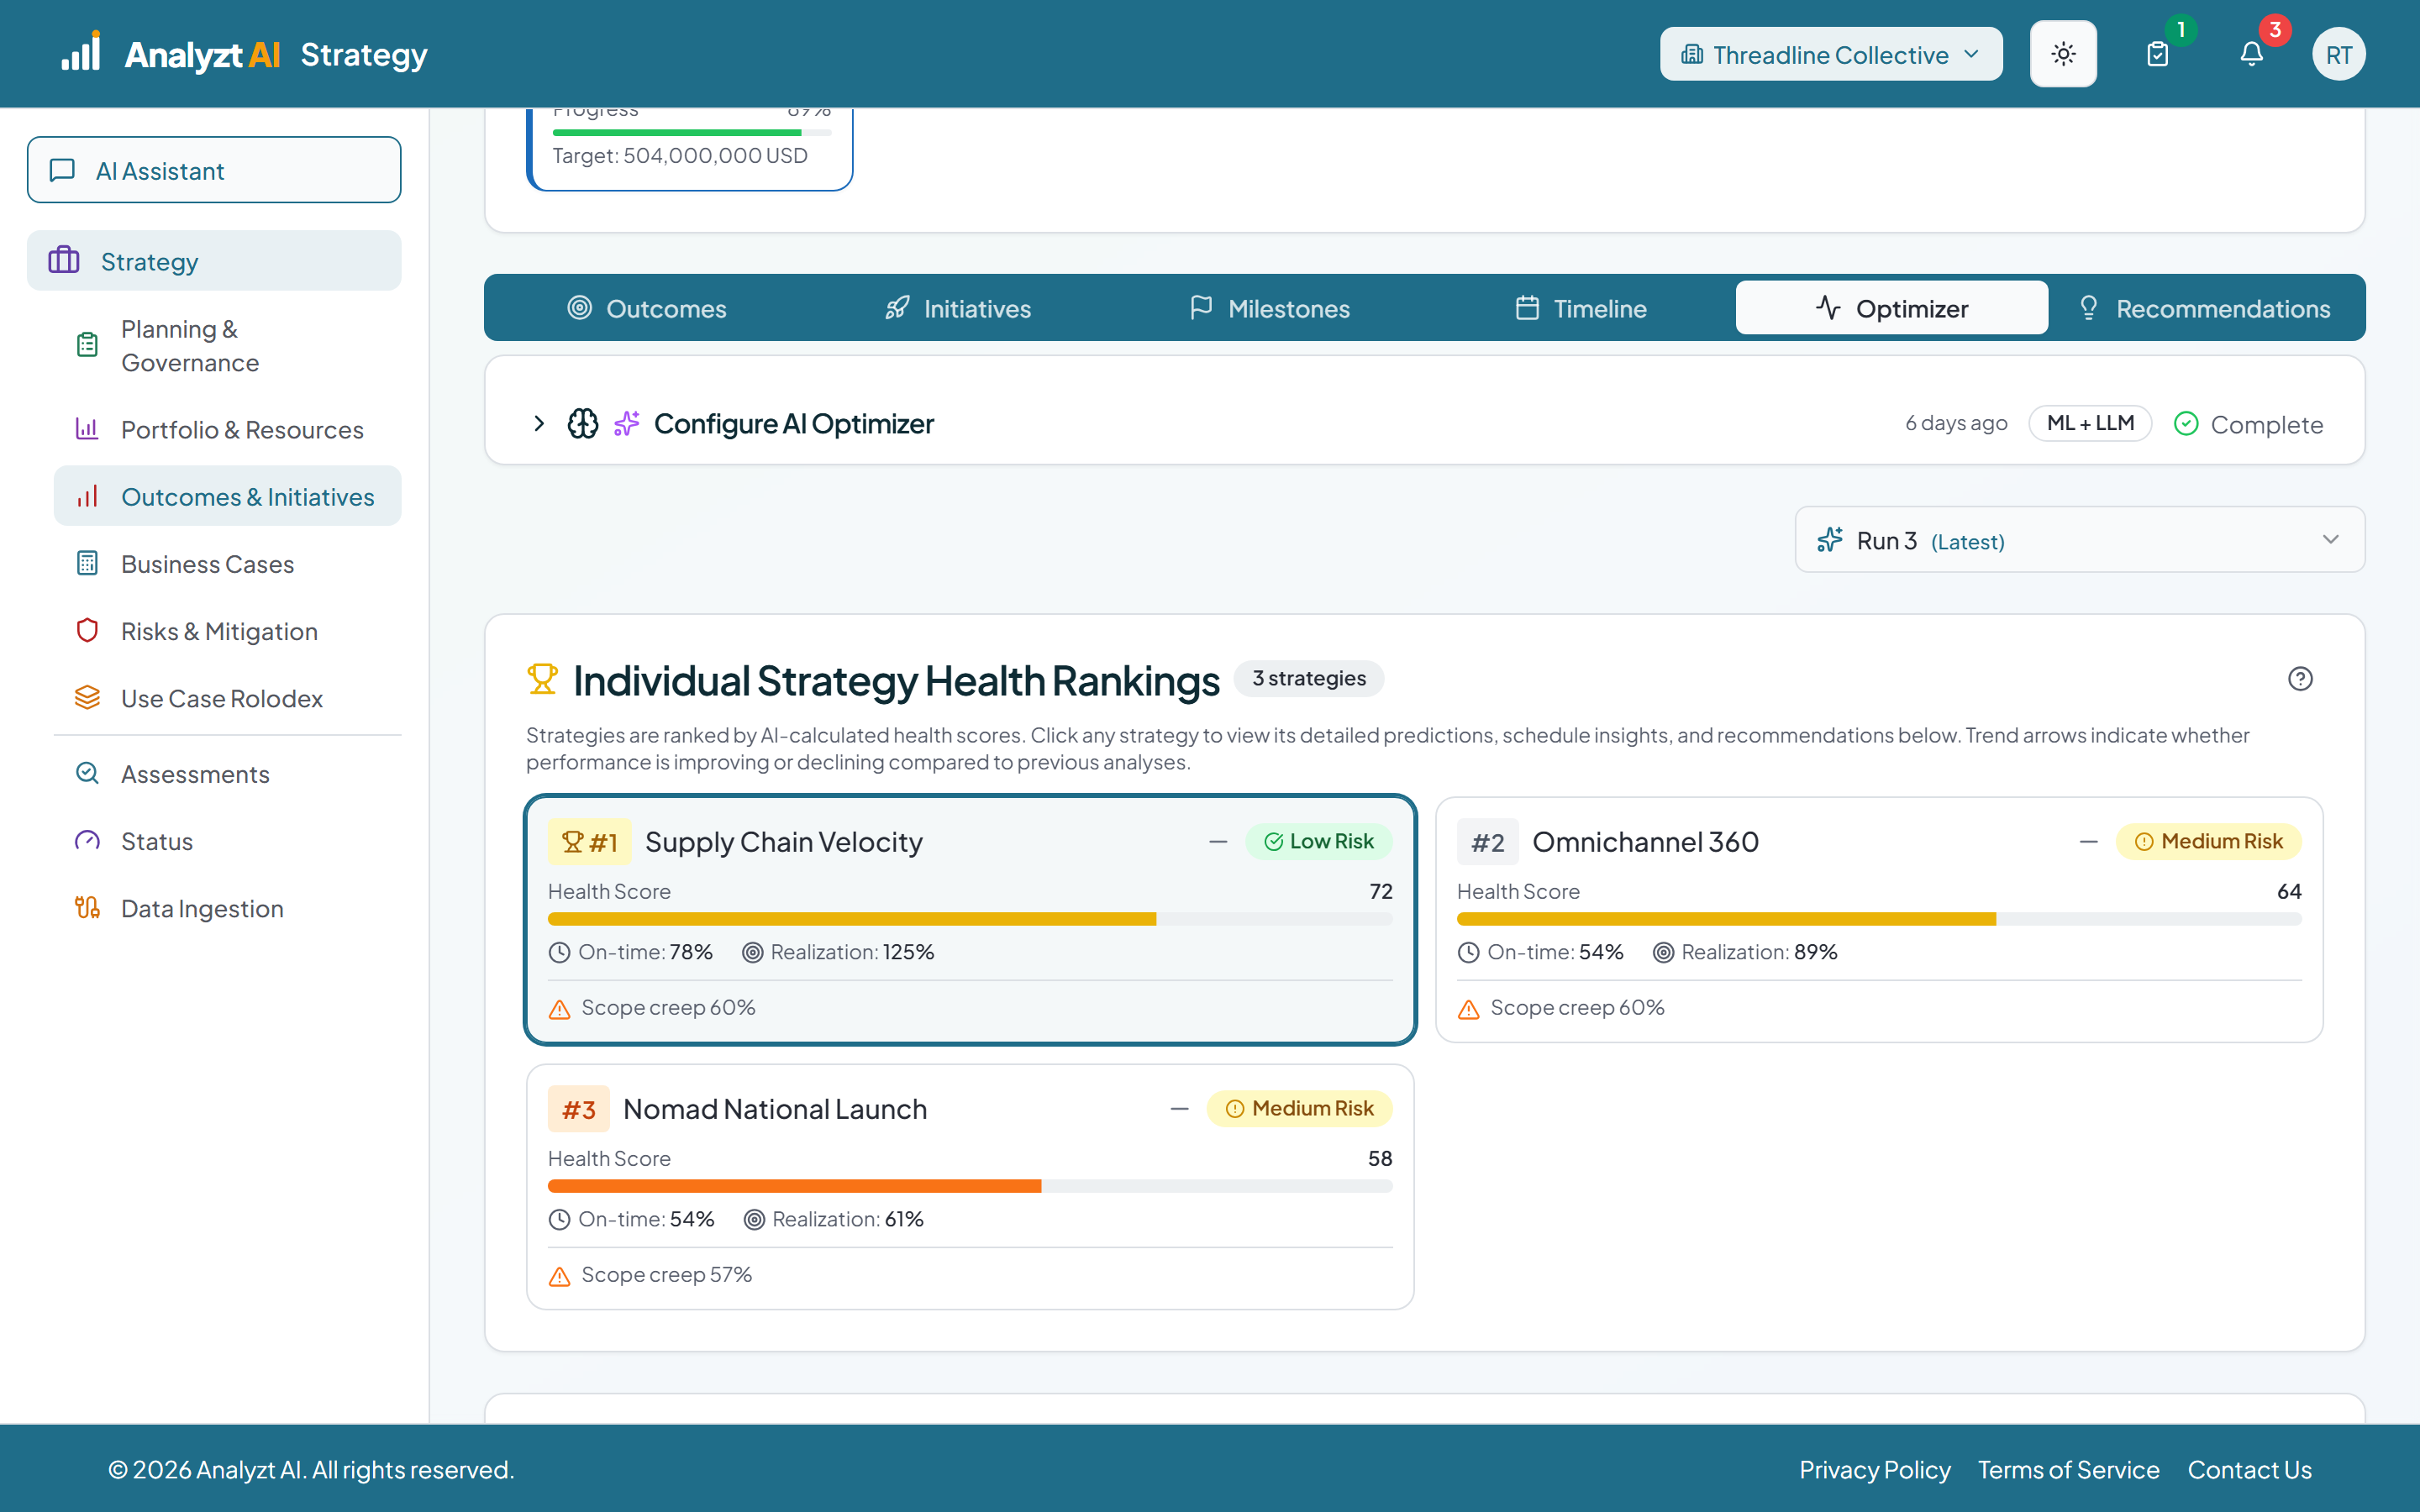
The Outcome and Initiative Optimizer
~1 minHealth scores, predictions for every outcome, initiative and milestone, the inputs that drove them, and how confidence falls as the horizon lengthens.
Seen enough to talk?
Onboarding is hands on and starts with a 20 minute call. Free during beta, Founding Member terms locked in.
Start a conversationPrefer to pick a time now? Book 20 minutes directly. Prefer to write first? Use the contact form.